Clients & Ventures
Product/systems design that turns AI tech into business results


Contact Us
Contact form or information will go here.
Project Detail

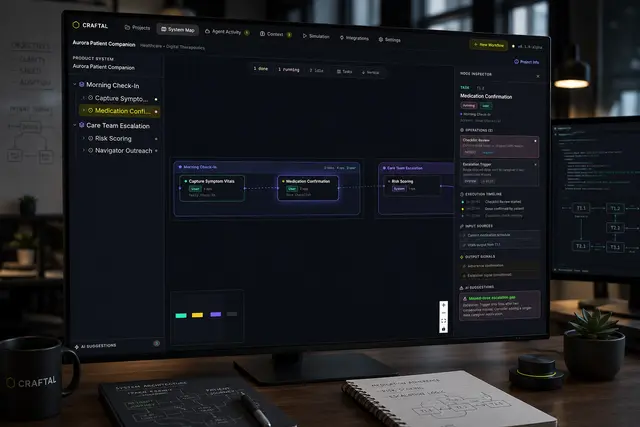
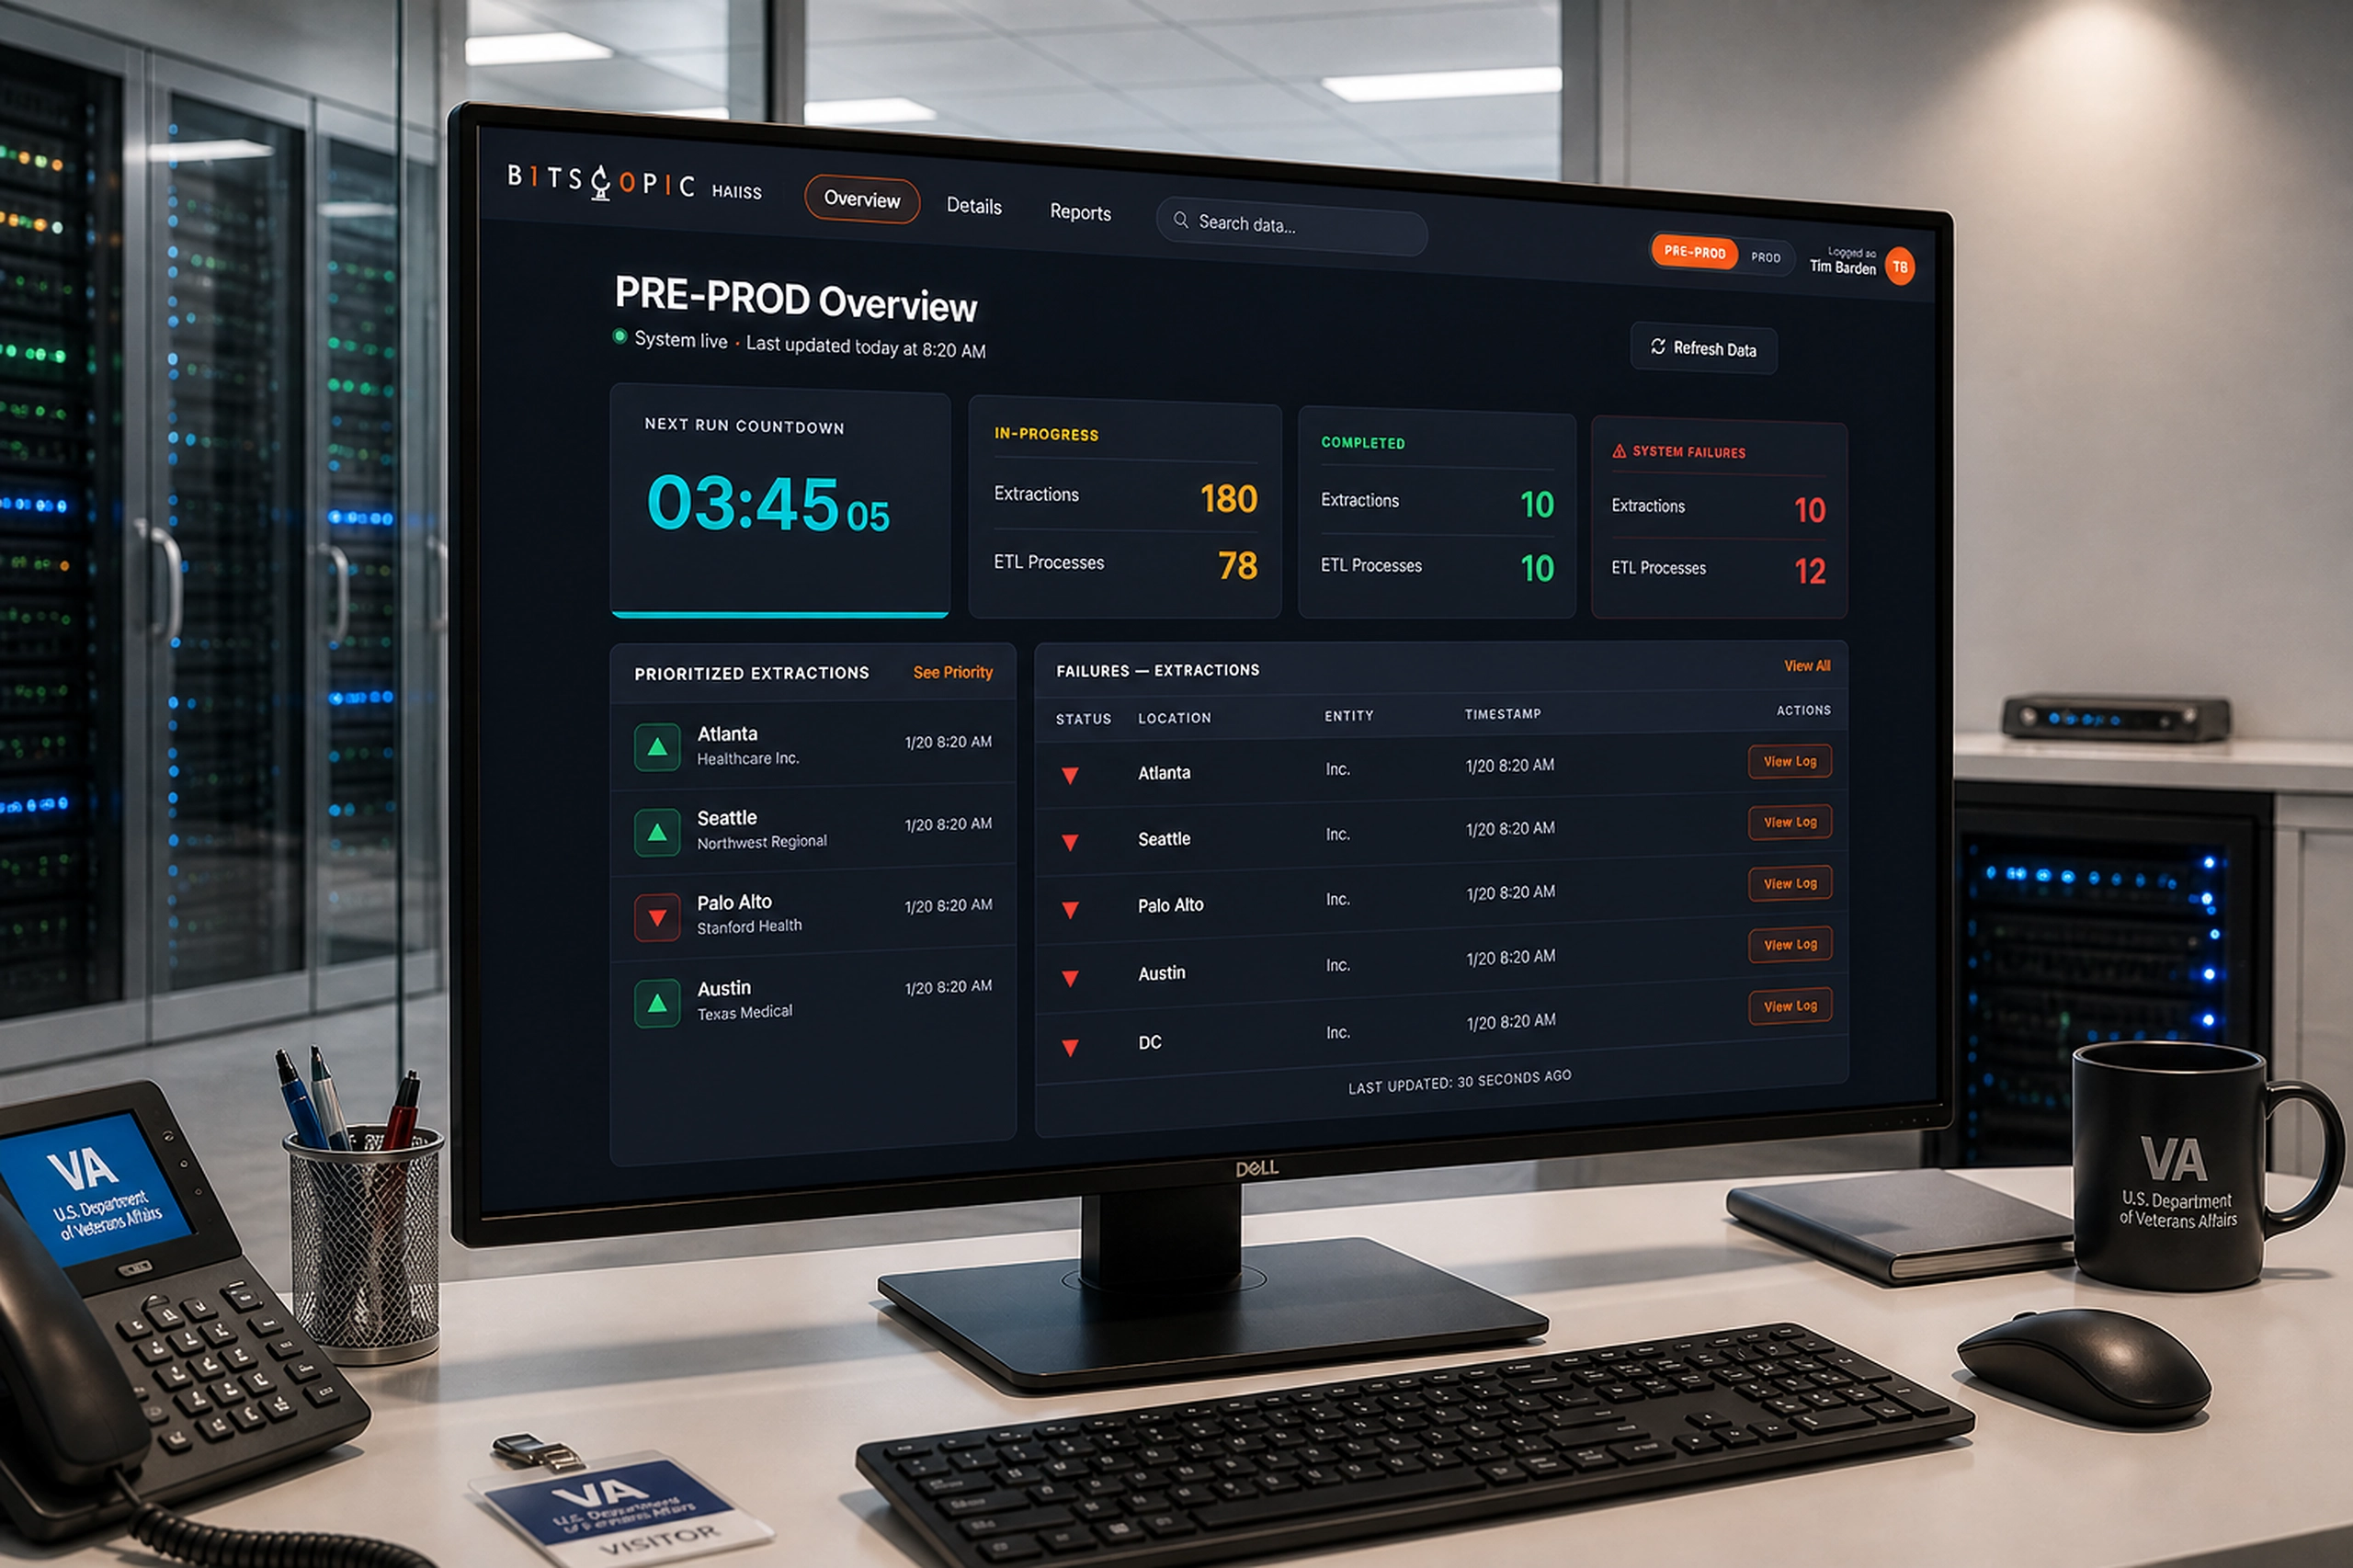
HAIISS Data Migration Monitoring
Summary
Healthcare monitoring interface that helped teams track extraction failures, prioritize sites, and understand system health faster.
HAIISS was a healthcare data operations product used to monitor extraction and ETL processes across multiple sites before production release. The work sat at the intersection of public health data, operational monitoring, and error recovery, where missing or failed data could quickly become a trust problem.
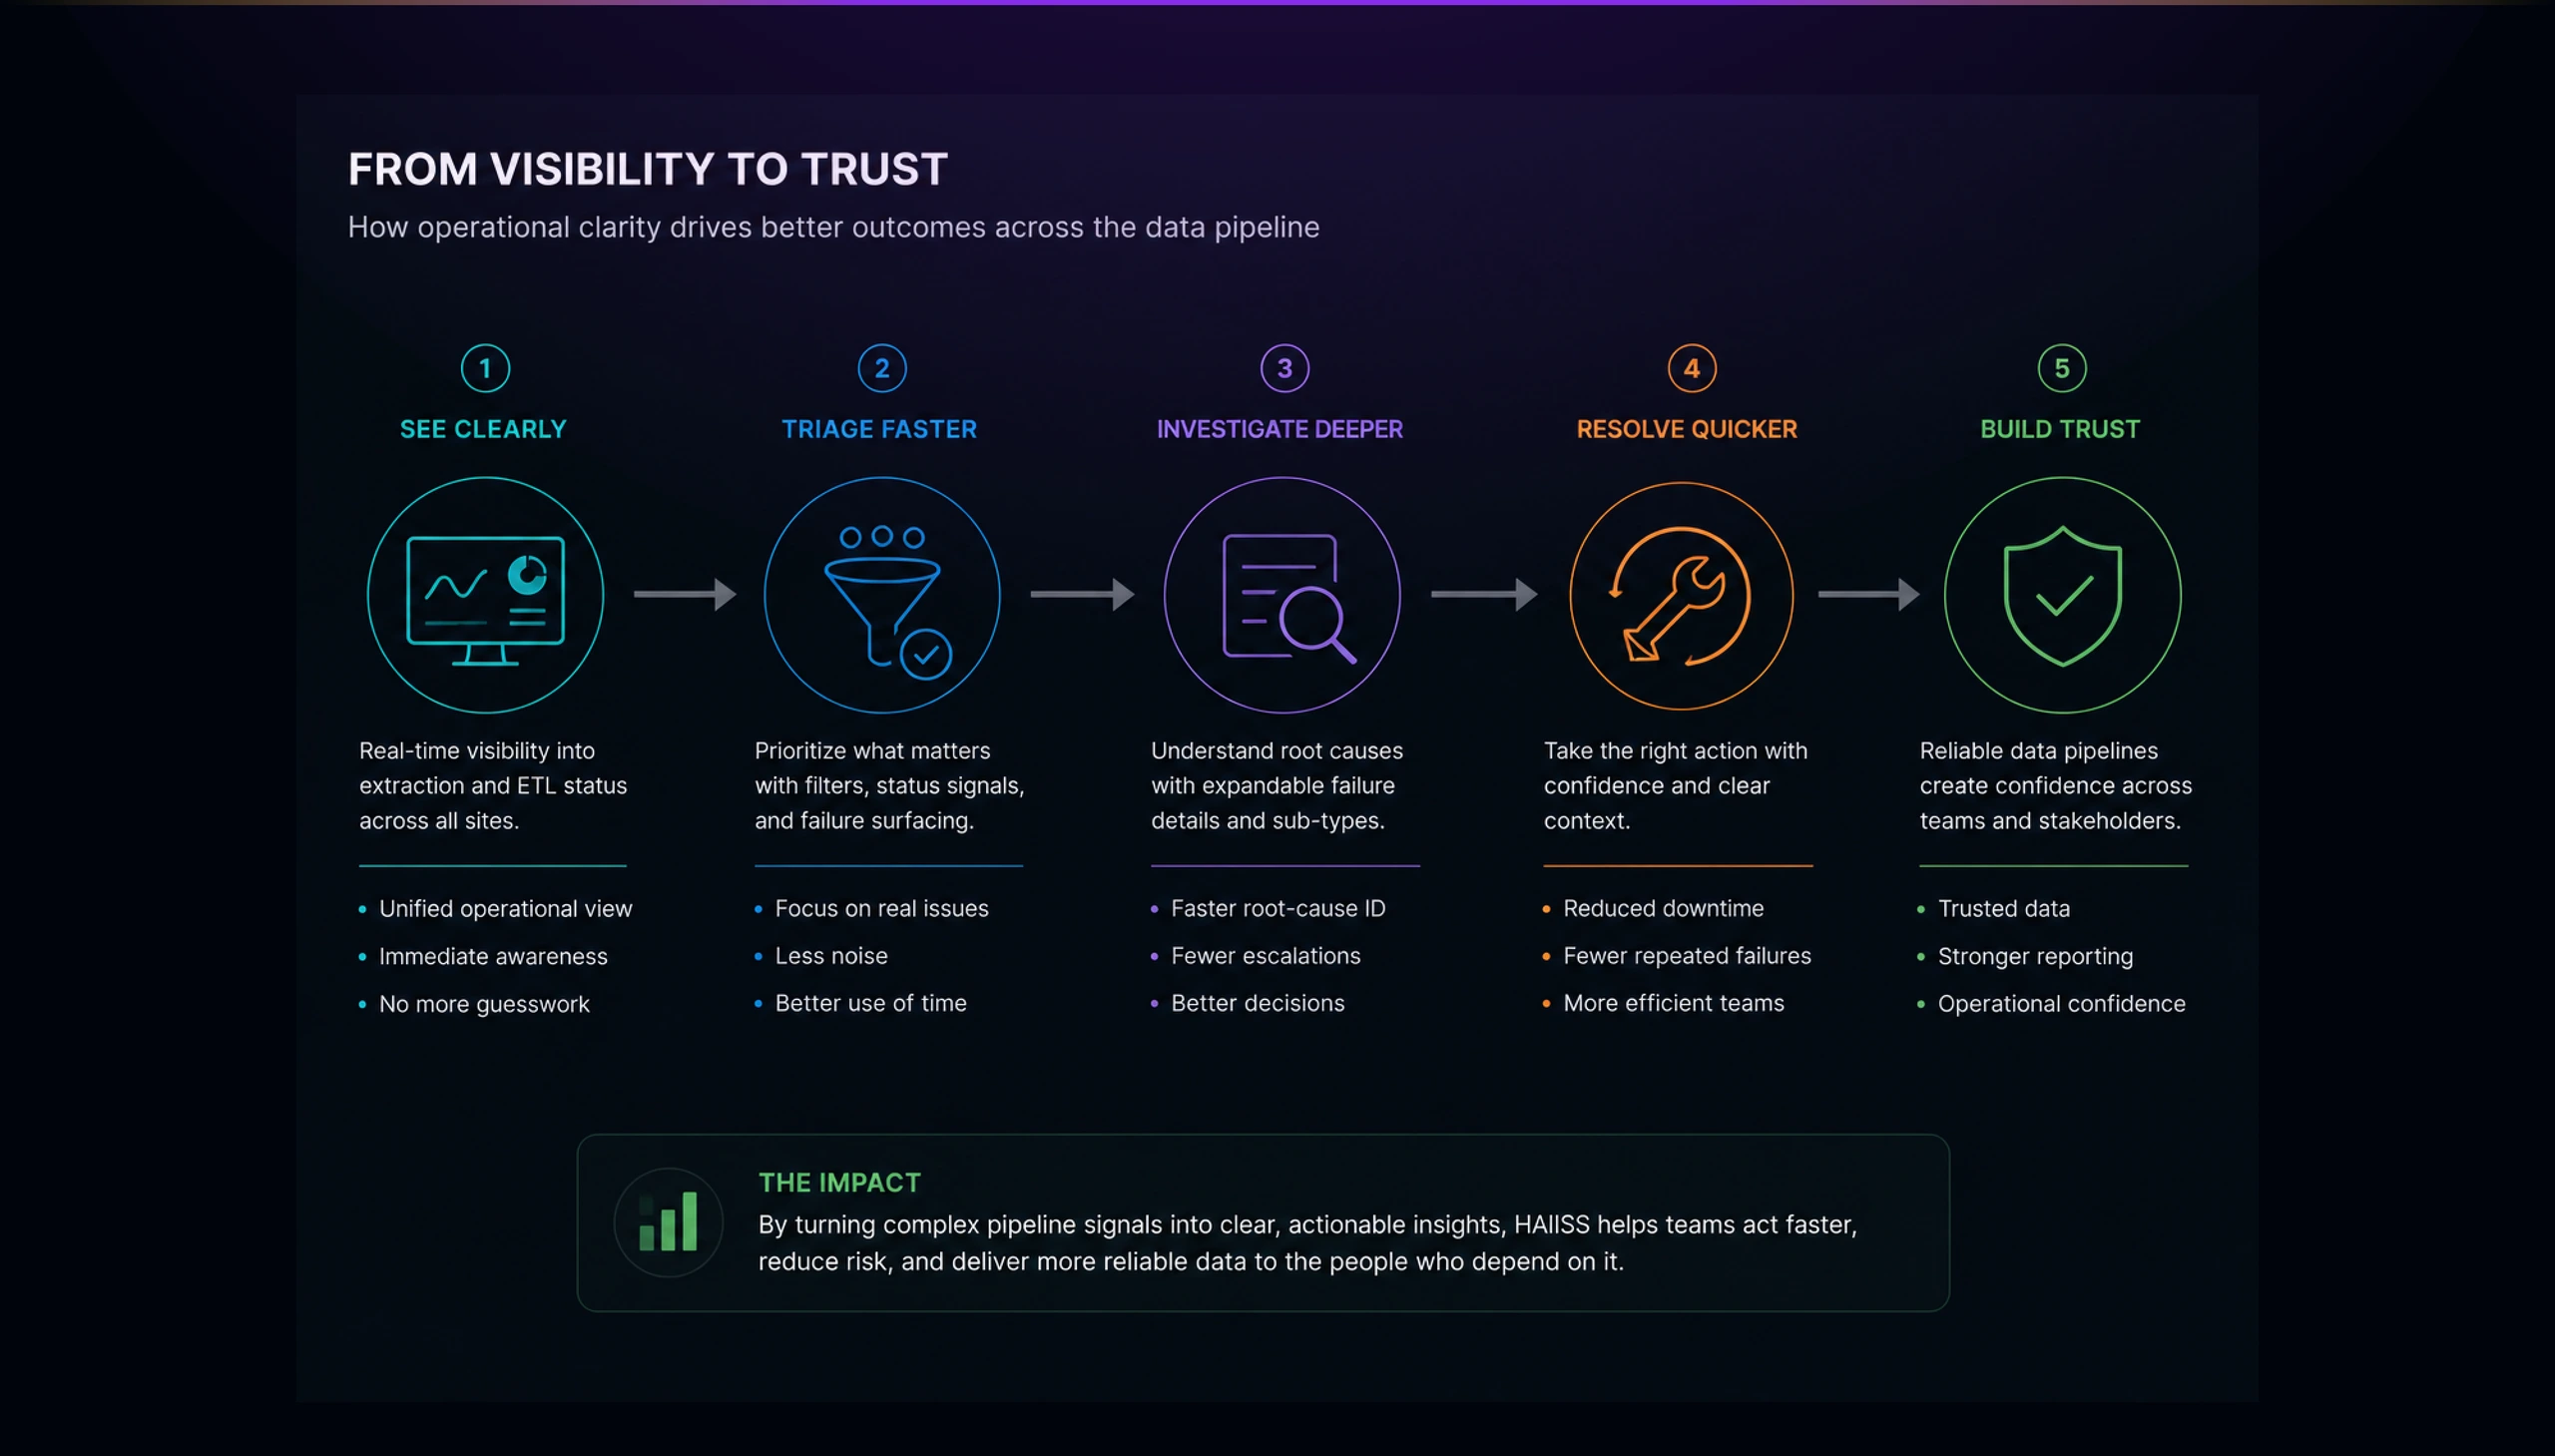
I helped redesign the experience around visibility, prioritization, and confidence. Instead of forcing users to interpret scattered process states, the interface surfaced what was running, what failed, what needed attention, and where teams should act next.
Outcome
Faster triage, clearer ownership, and more confidence in the system.
The redesigned HAIISS experience made the health of the system easier to read. Users could quickly see what was running, what had completed, what had failed, and which locations needed attention. The interface reduced the need to infer operational status from disconnected signals.
The biggest impact was clarity. The product gave technical and operational users a shared view of extraction and ETL health. That helped teams prioritize failures, inspect site-level issues, and communicate system state with more confidence.
Practical improvements included:
- Faster identification of failed sites and failed process stages.
- Clearer separation between routine processing and urgent operational issues.
- Better visibility into extraction and ETL status across locations.
- More actionable failure investigation through expanded sub-types.
- A reporting layer that helped teams understand performance over time.
The Problem
Making invisible pipeline failures impossible to ignore
Healthcare data workflows are only useful when teams can trust that the right data arrived, moved through the right process, and ended up in the right state. In HAIISS, the core challenge was not simply showing data. The challenge was helping operators understand the health of a distributed extraction and ETL system before small failures became larger operational risks.
The existing workflow depended on too much interpretation. A failed extraction, an incomplete ETL process, or a delayed site update could look like a technical detail, but for the people running the system, those details affected confidence. Users needed to know which locations were healthy, which ones were failing, and which failures deserved immediate attention.
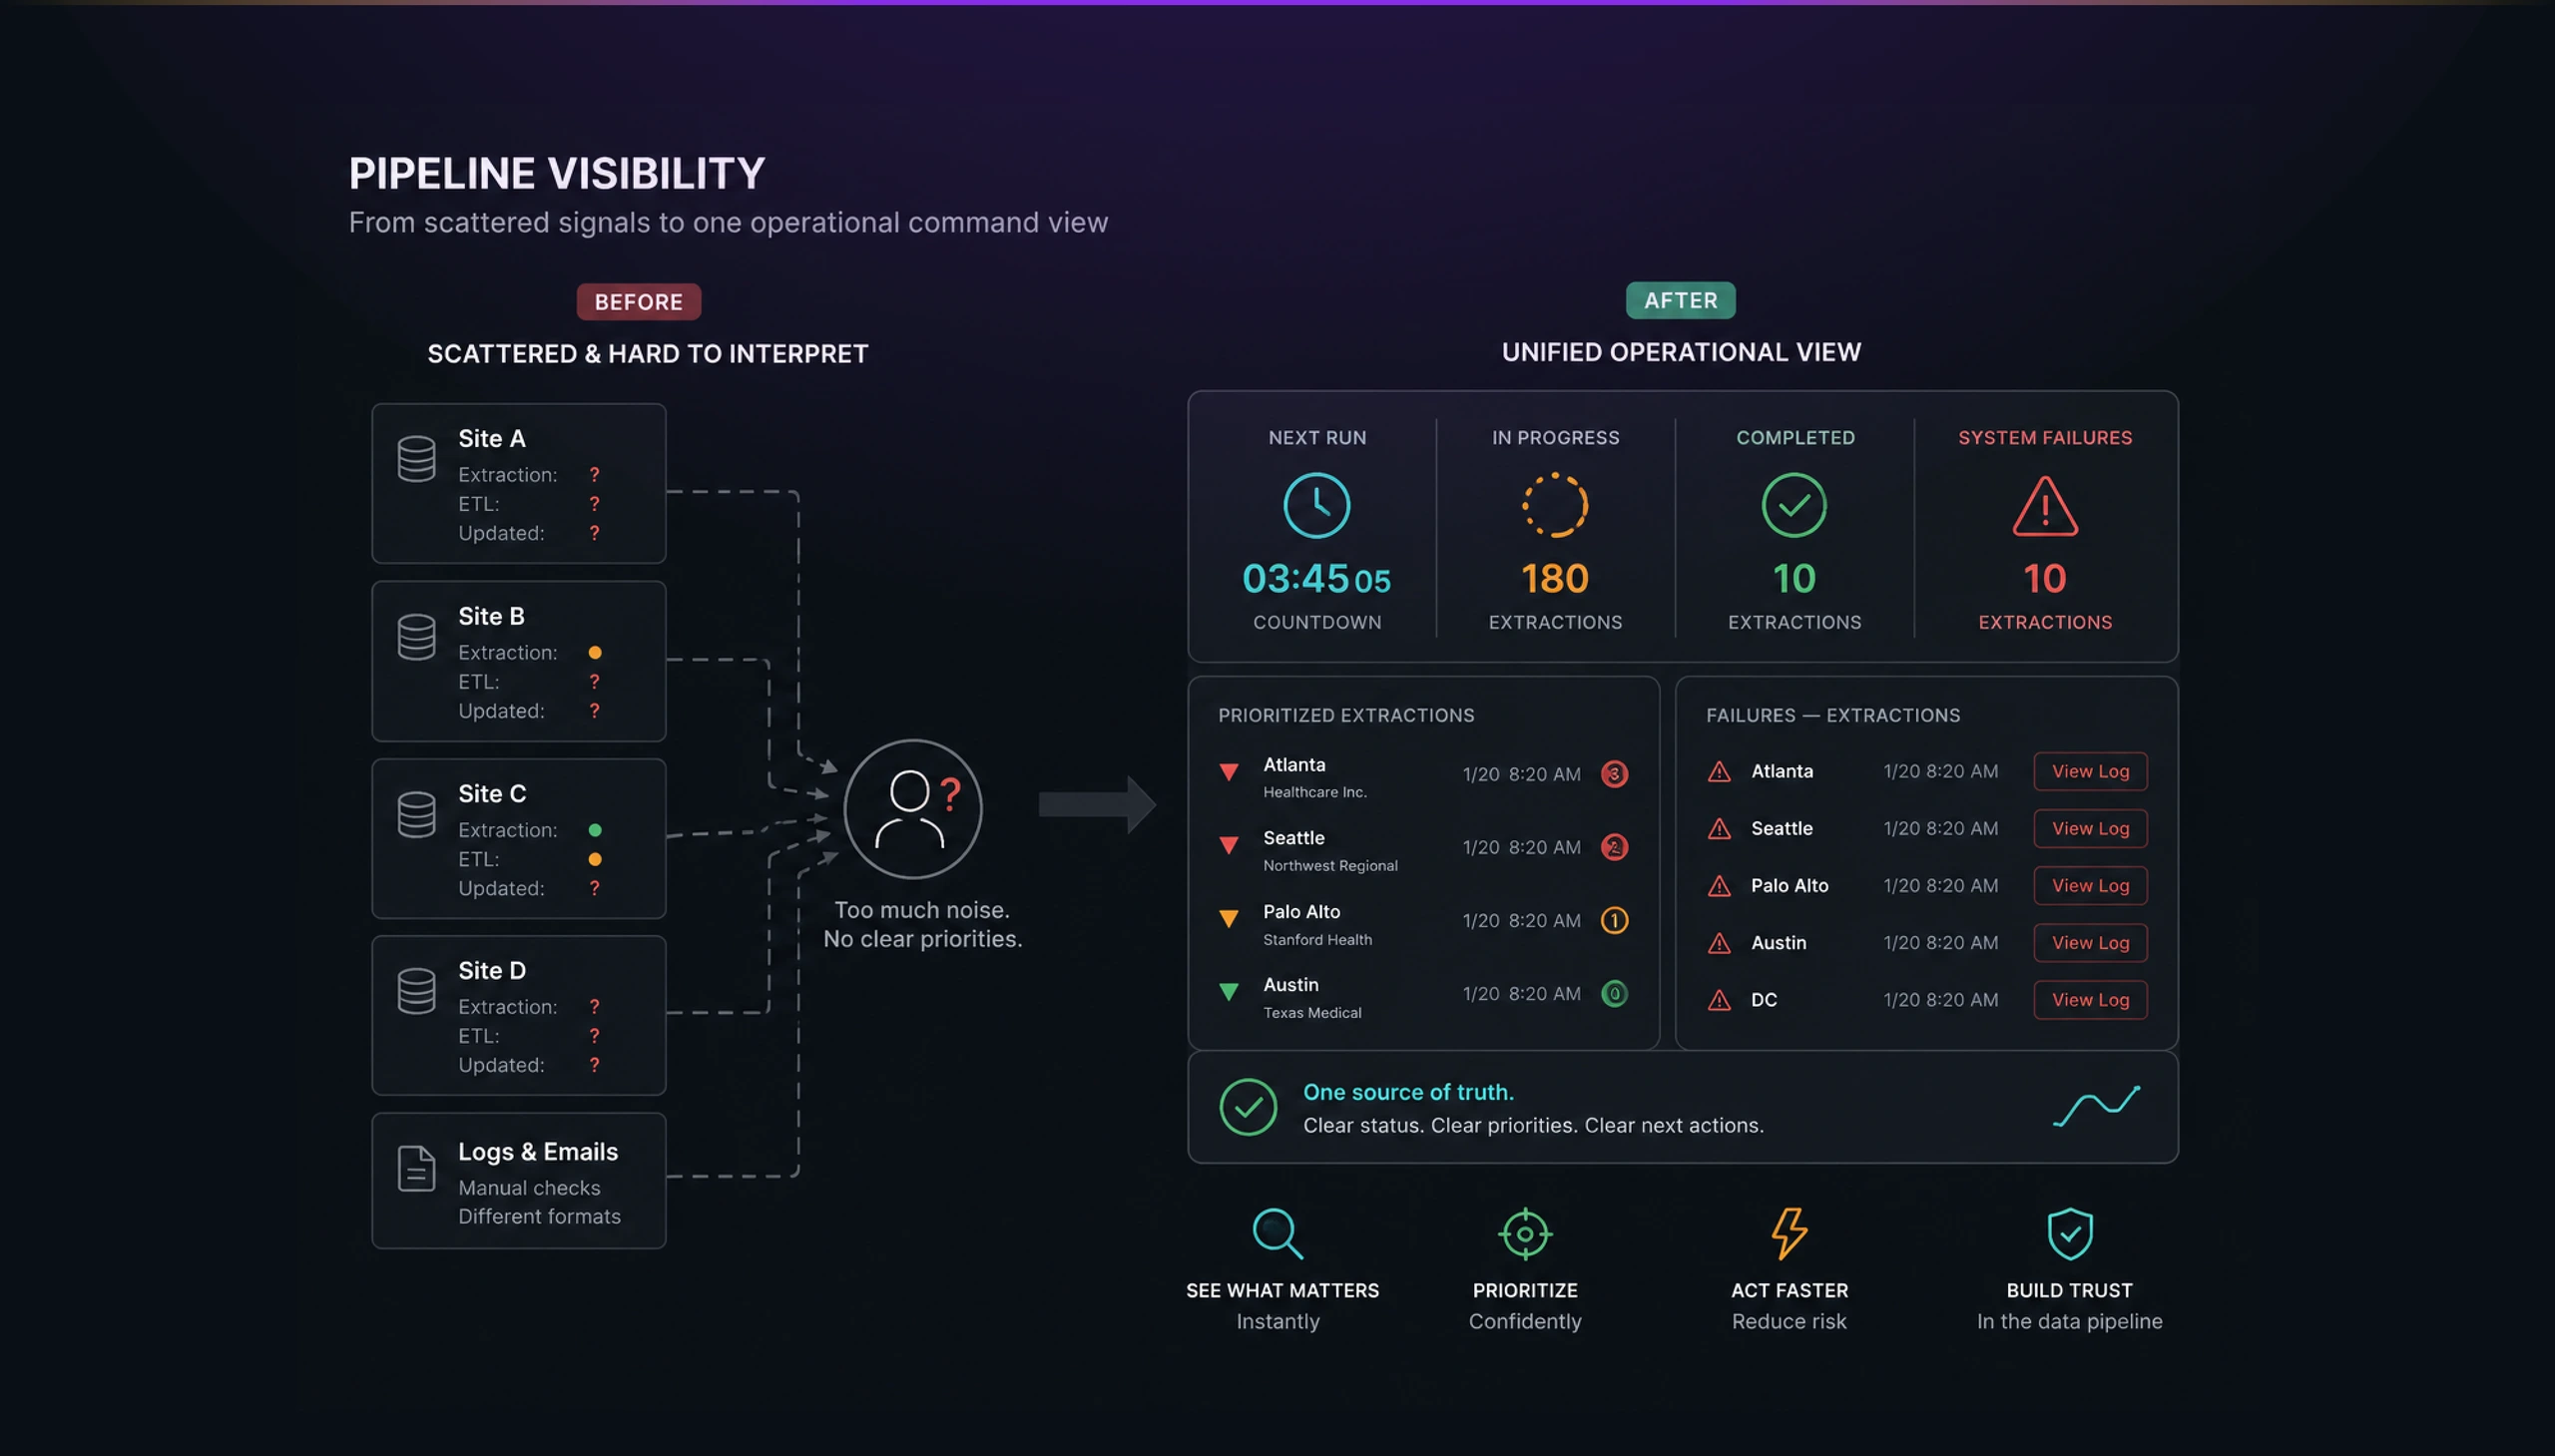
The important design problem was hierarchy. Not every status deserved the same visual weight. A running extraction mattered, but a repeated system failure mattered more. A completed ETL process was useful, but a location with multiple failed sub-types needed to rise above the noise. The interface had to separate routine processing from operational risk.
The risk was that teams would spend their time reading the system instead of operating it. In a healthcare environment, that is dangerous because trust depends on knowing quickly whether the pipeline is healthy, delayed, incomplete, or broken.
Solution
Designing around operational attention, not just data display
I approached the interface as a monitoring and triage system. The goal was to help users move from “what is happening?” to “what needs attention?” as quickly as possible.
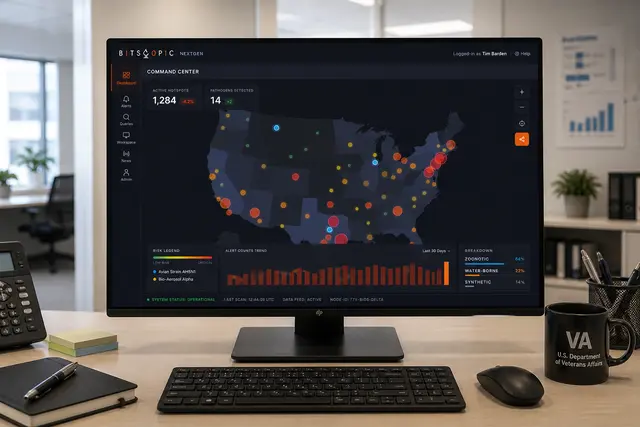
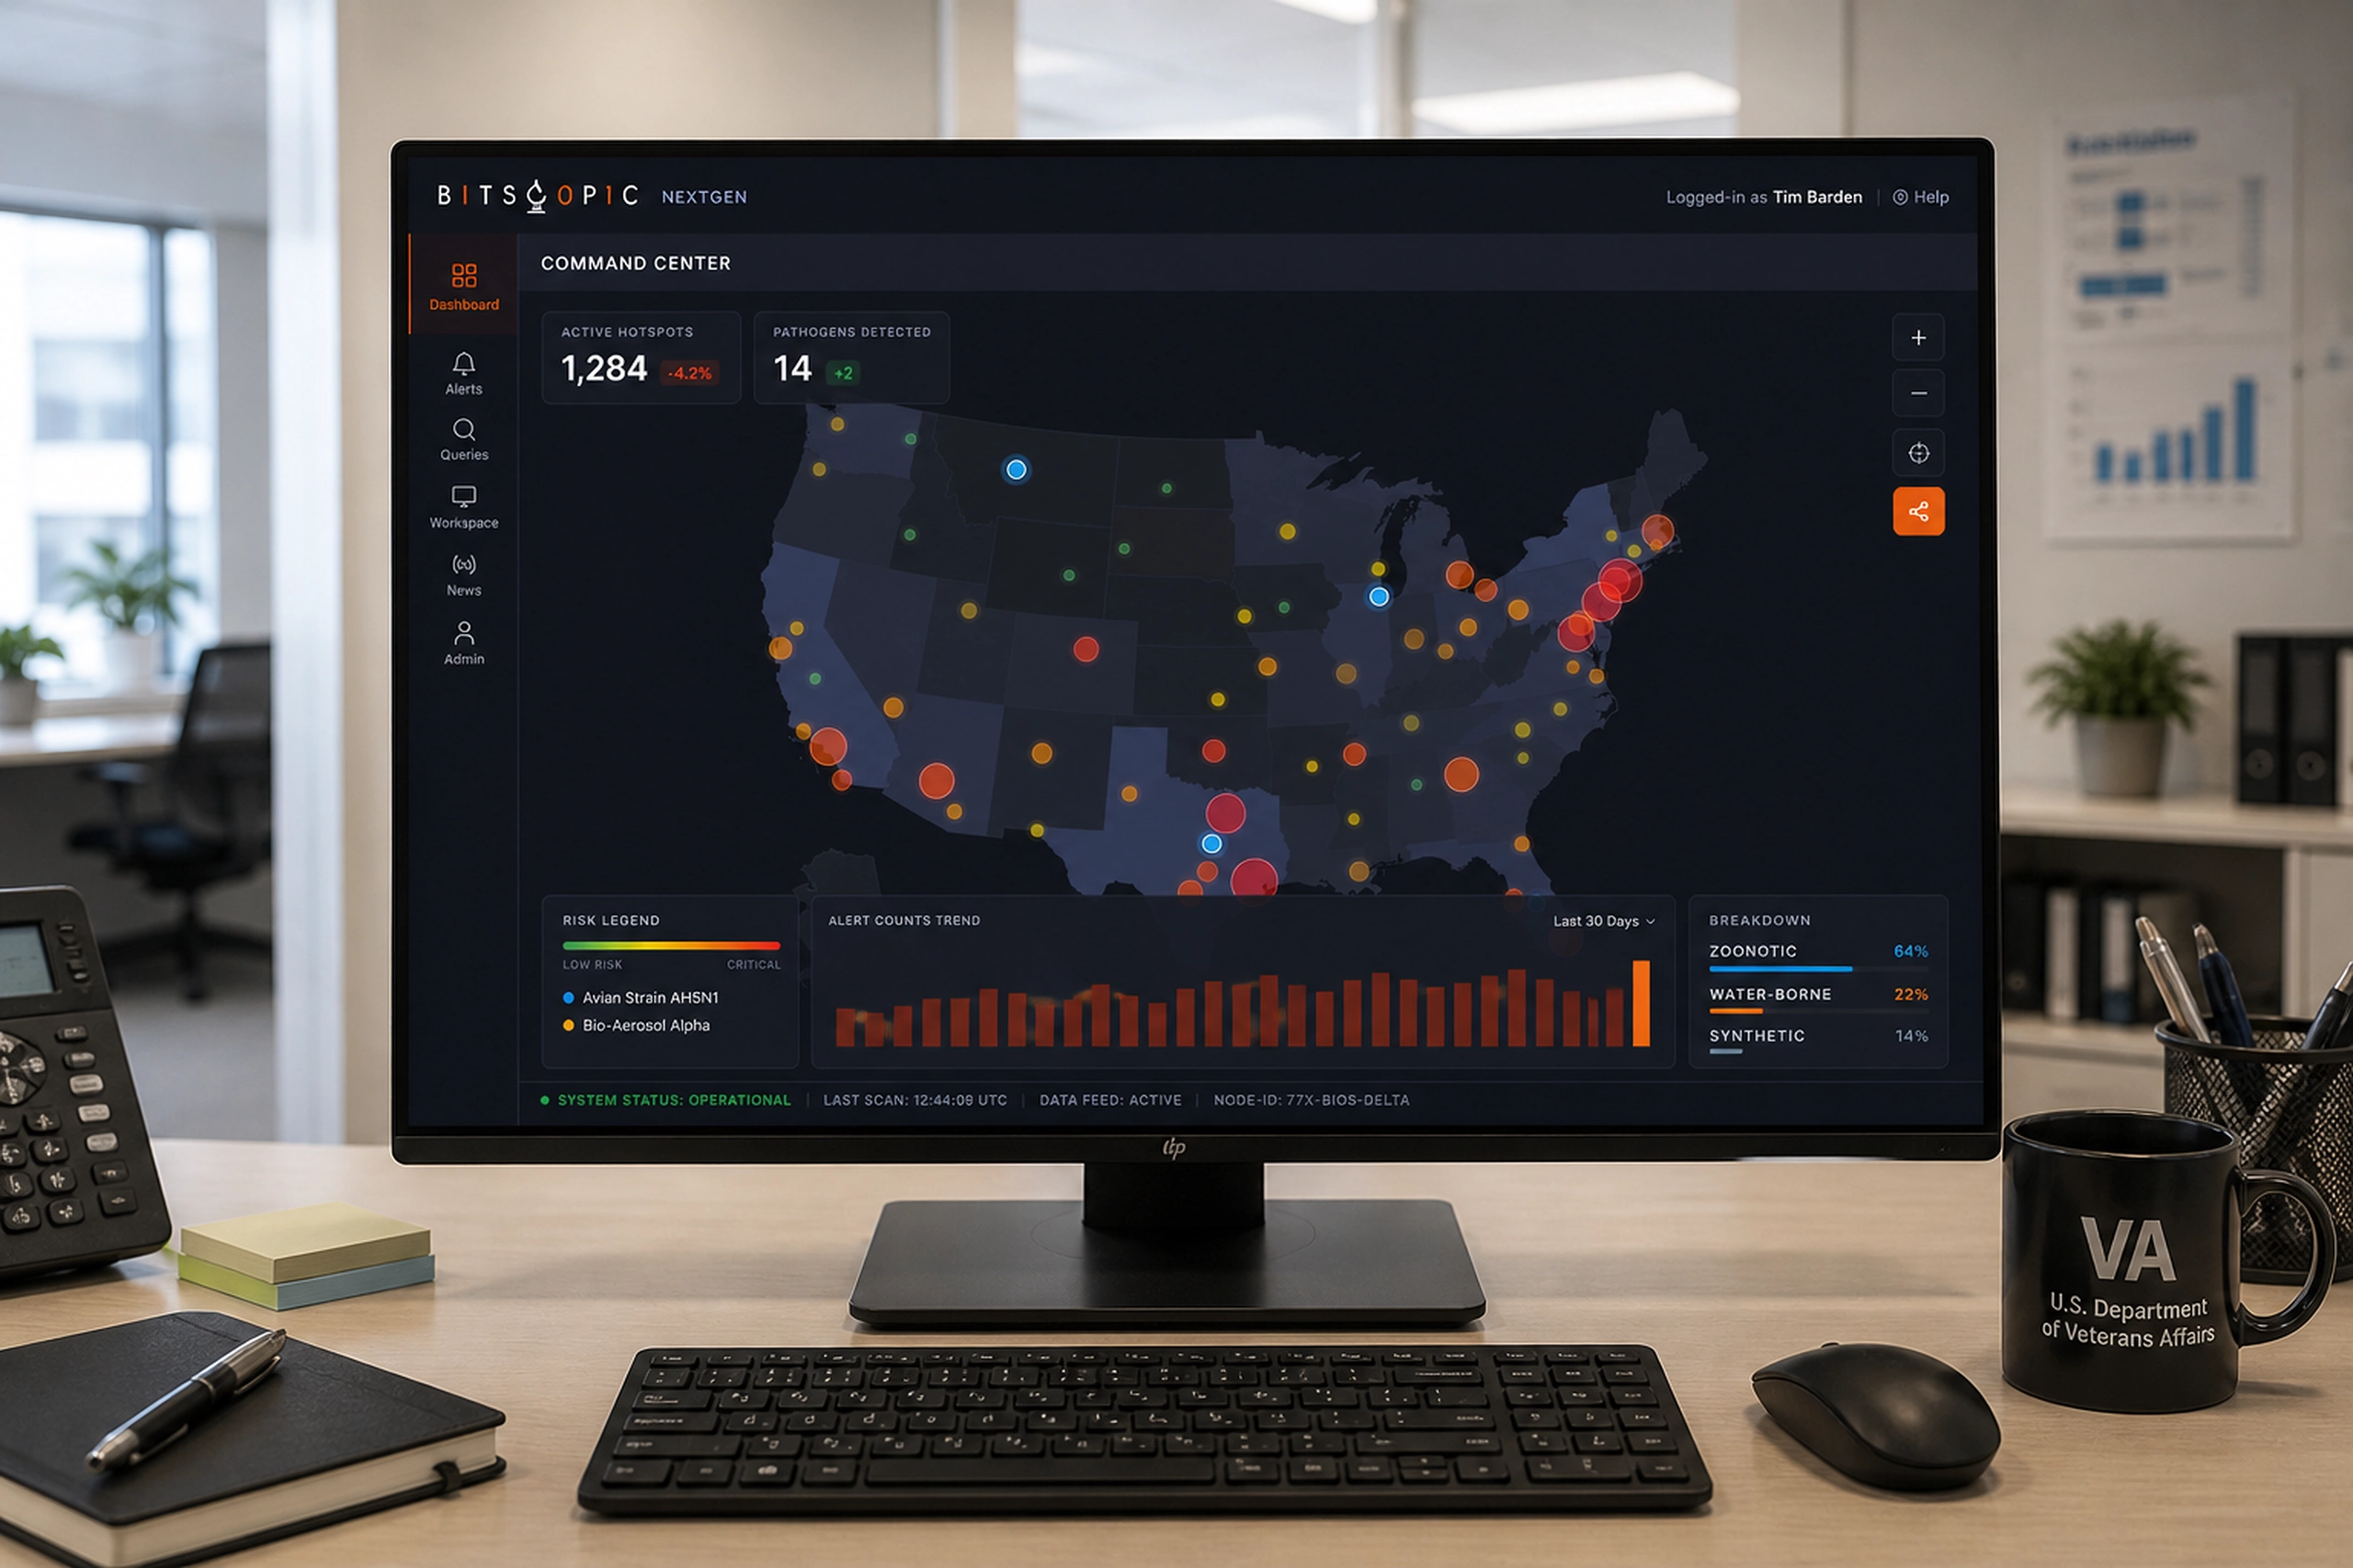
The overview screen became the starting point. I organized it around a few critical signals: the next run countdown, in-progress work, completed processes, system failures, prioritized extractions, and a visible failure log. This gave users a fast mental model of the system without requiring them to inspect every site manually.
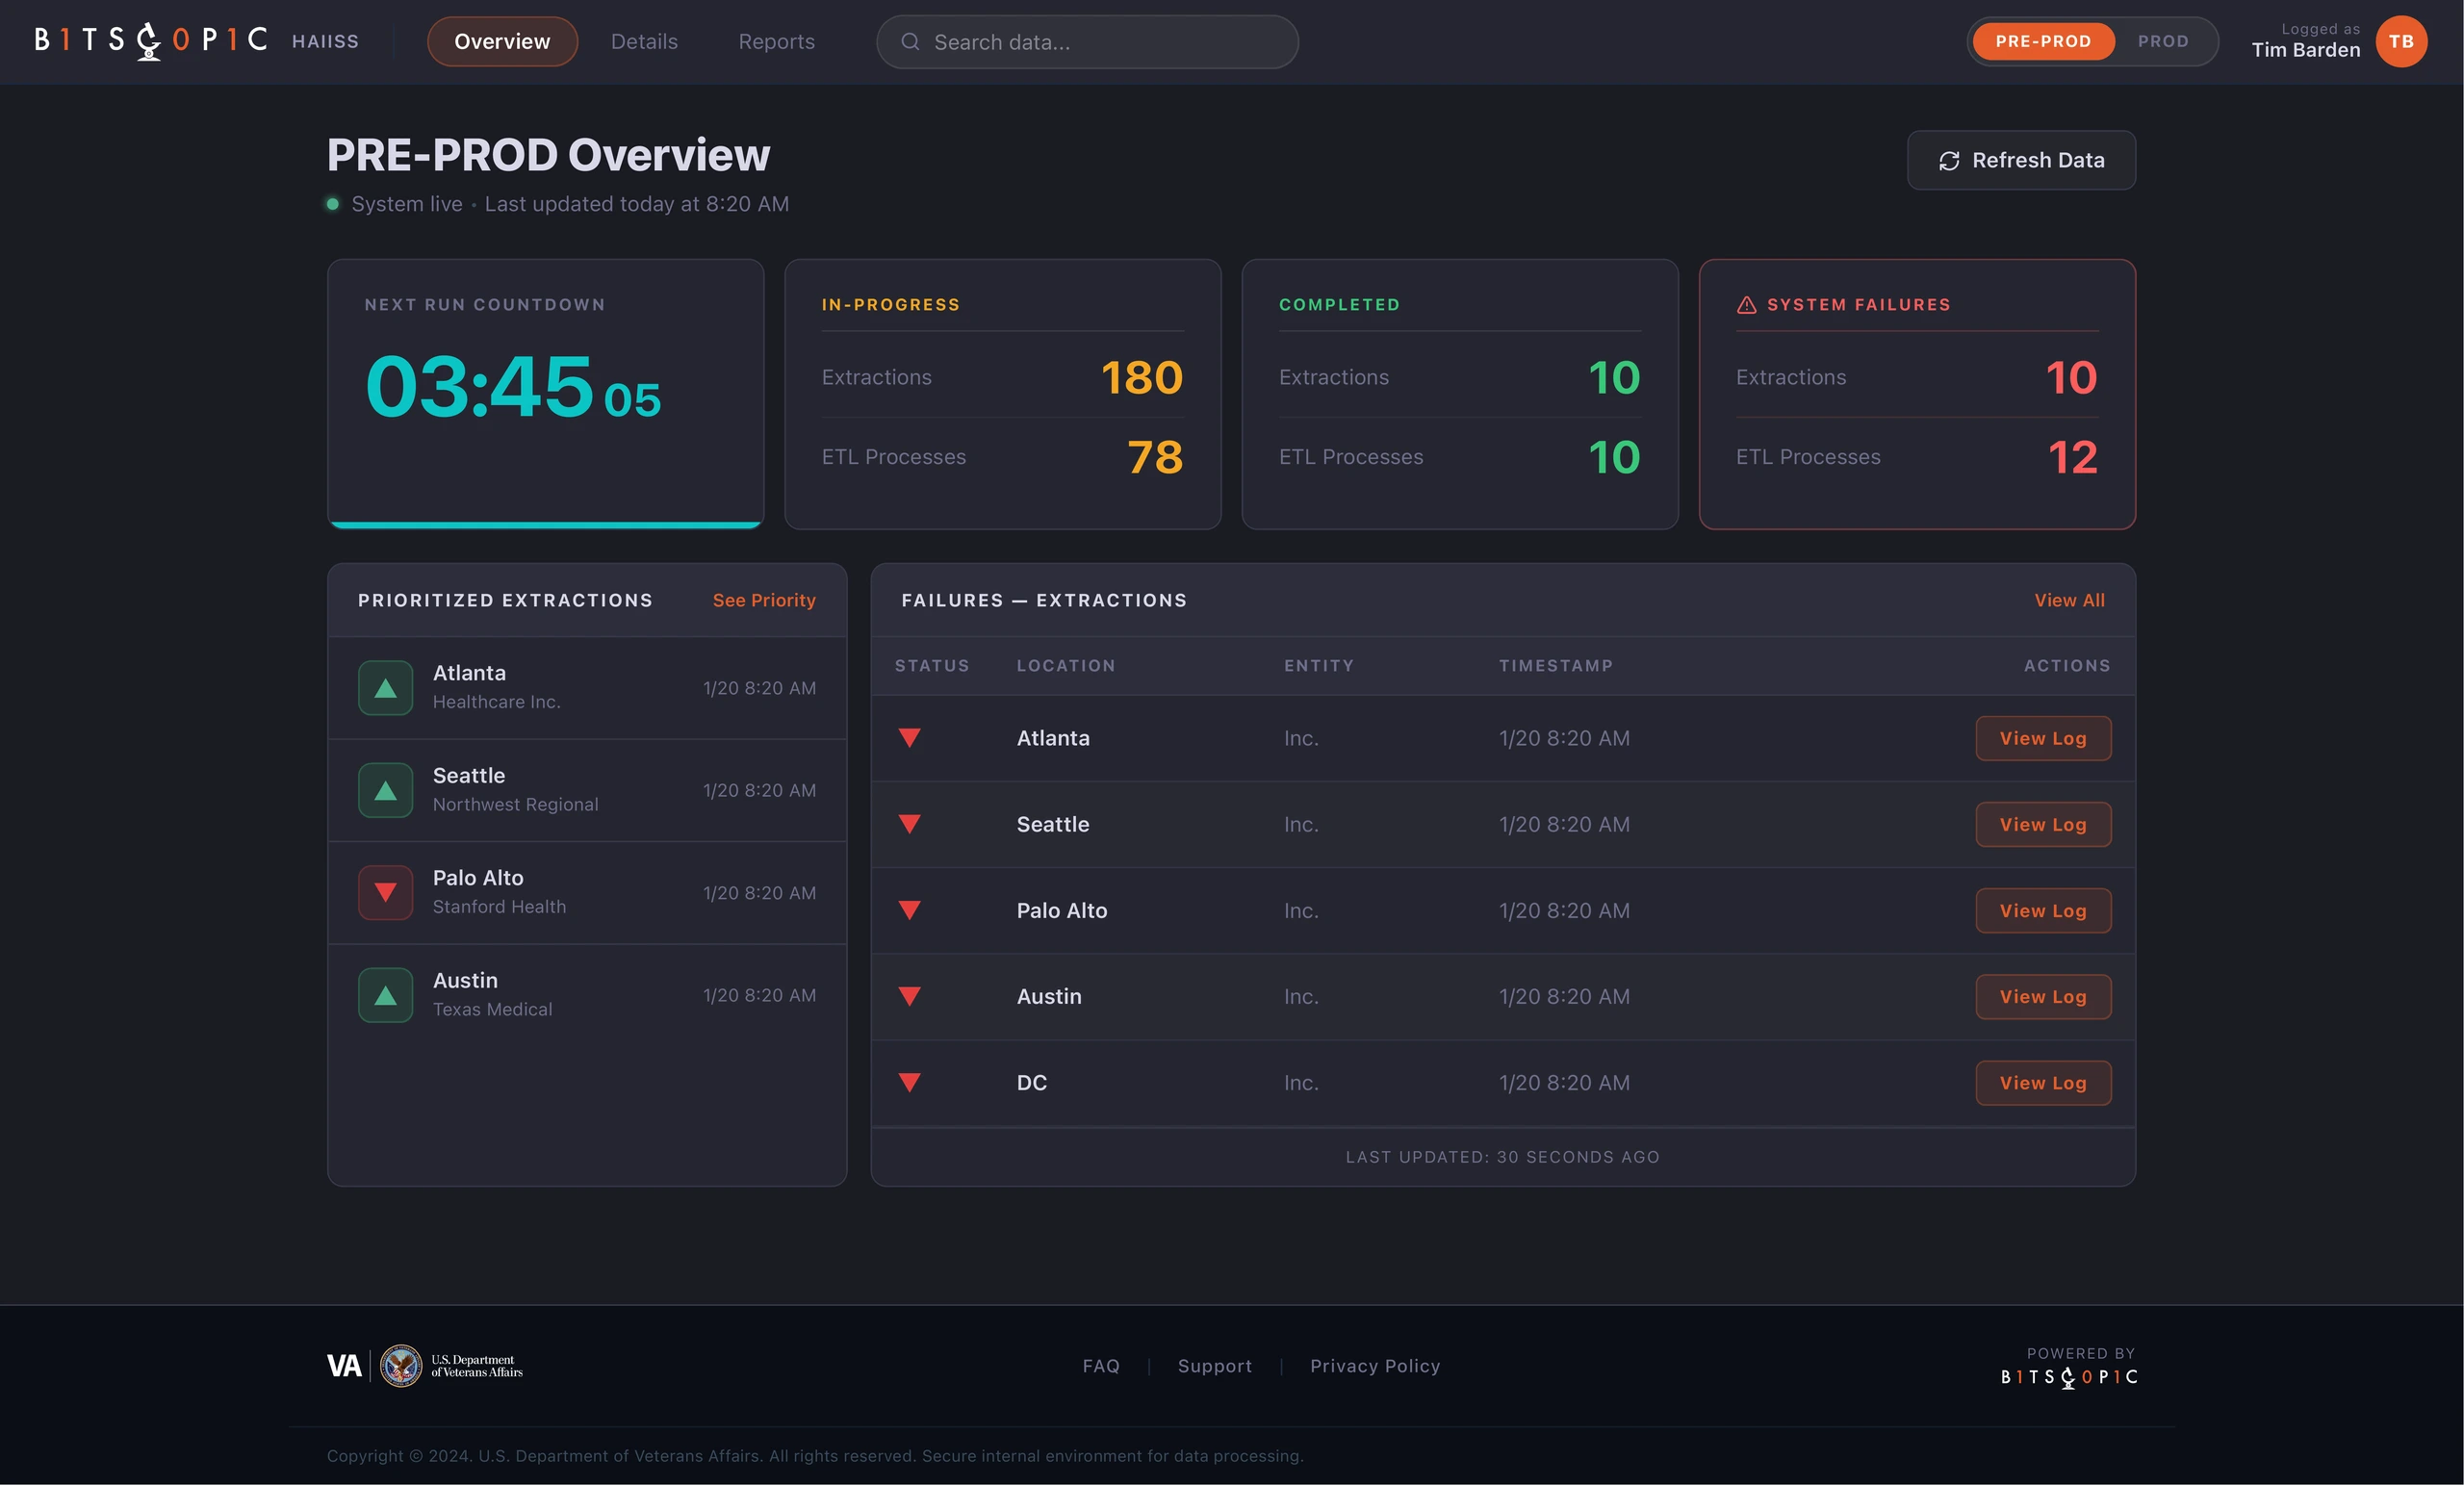
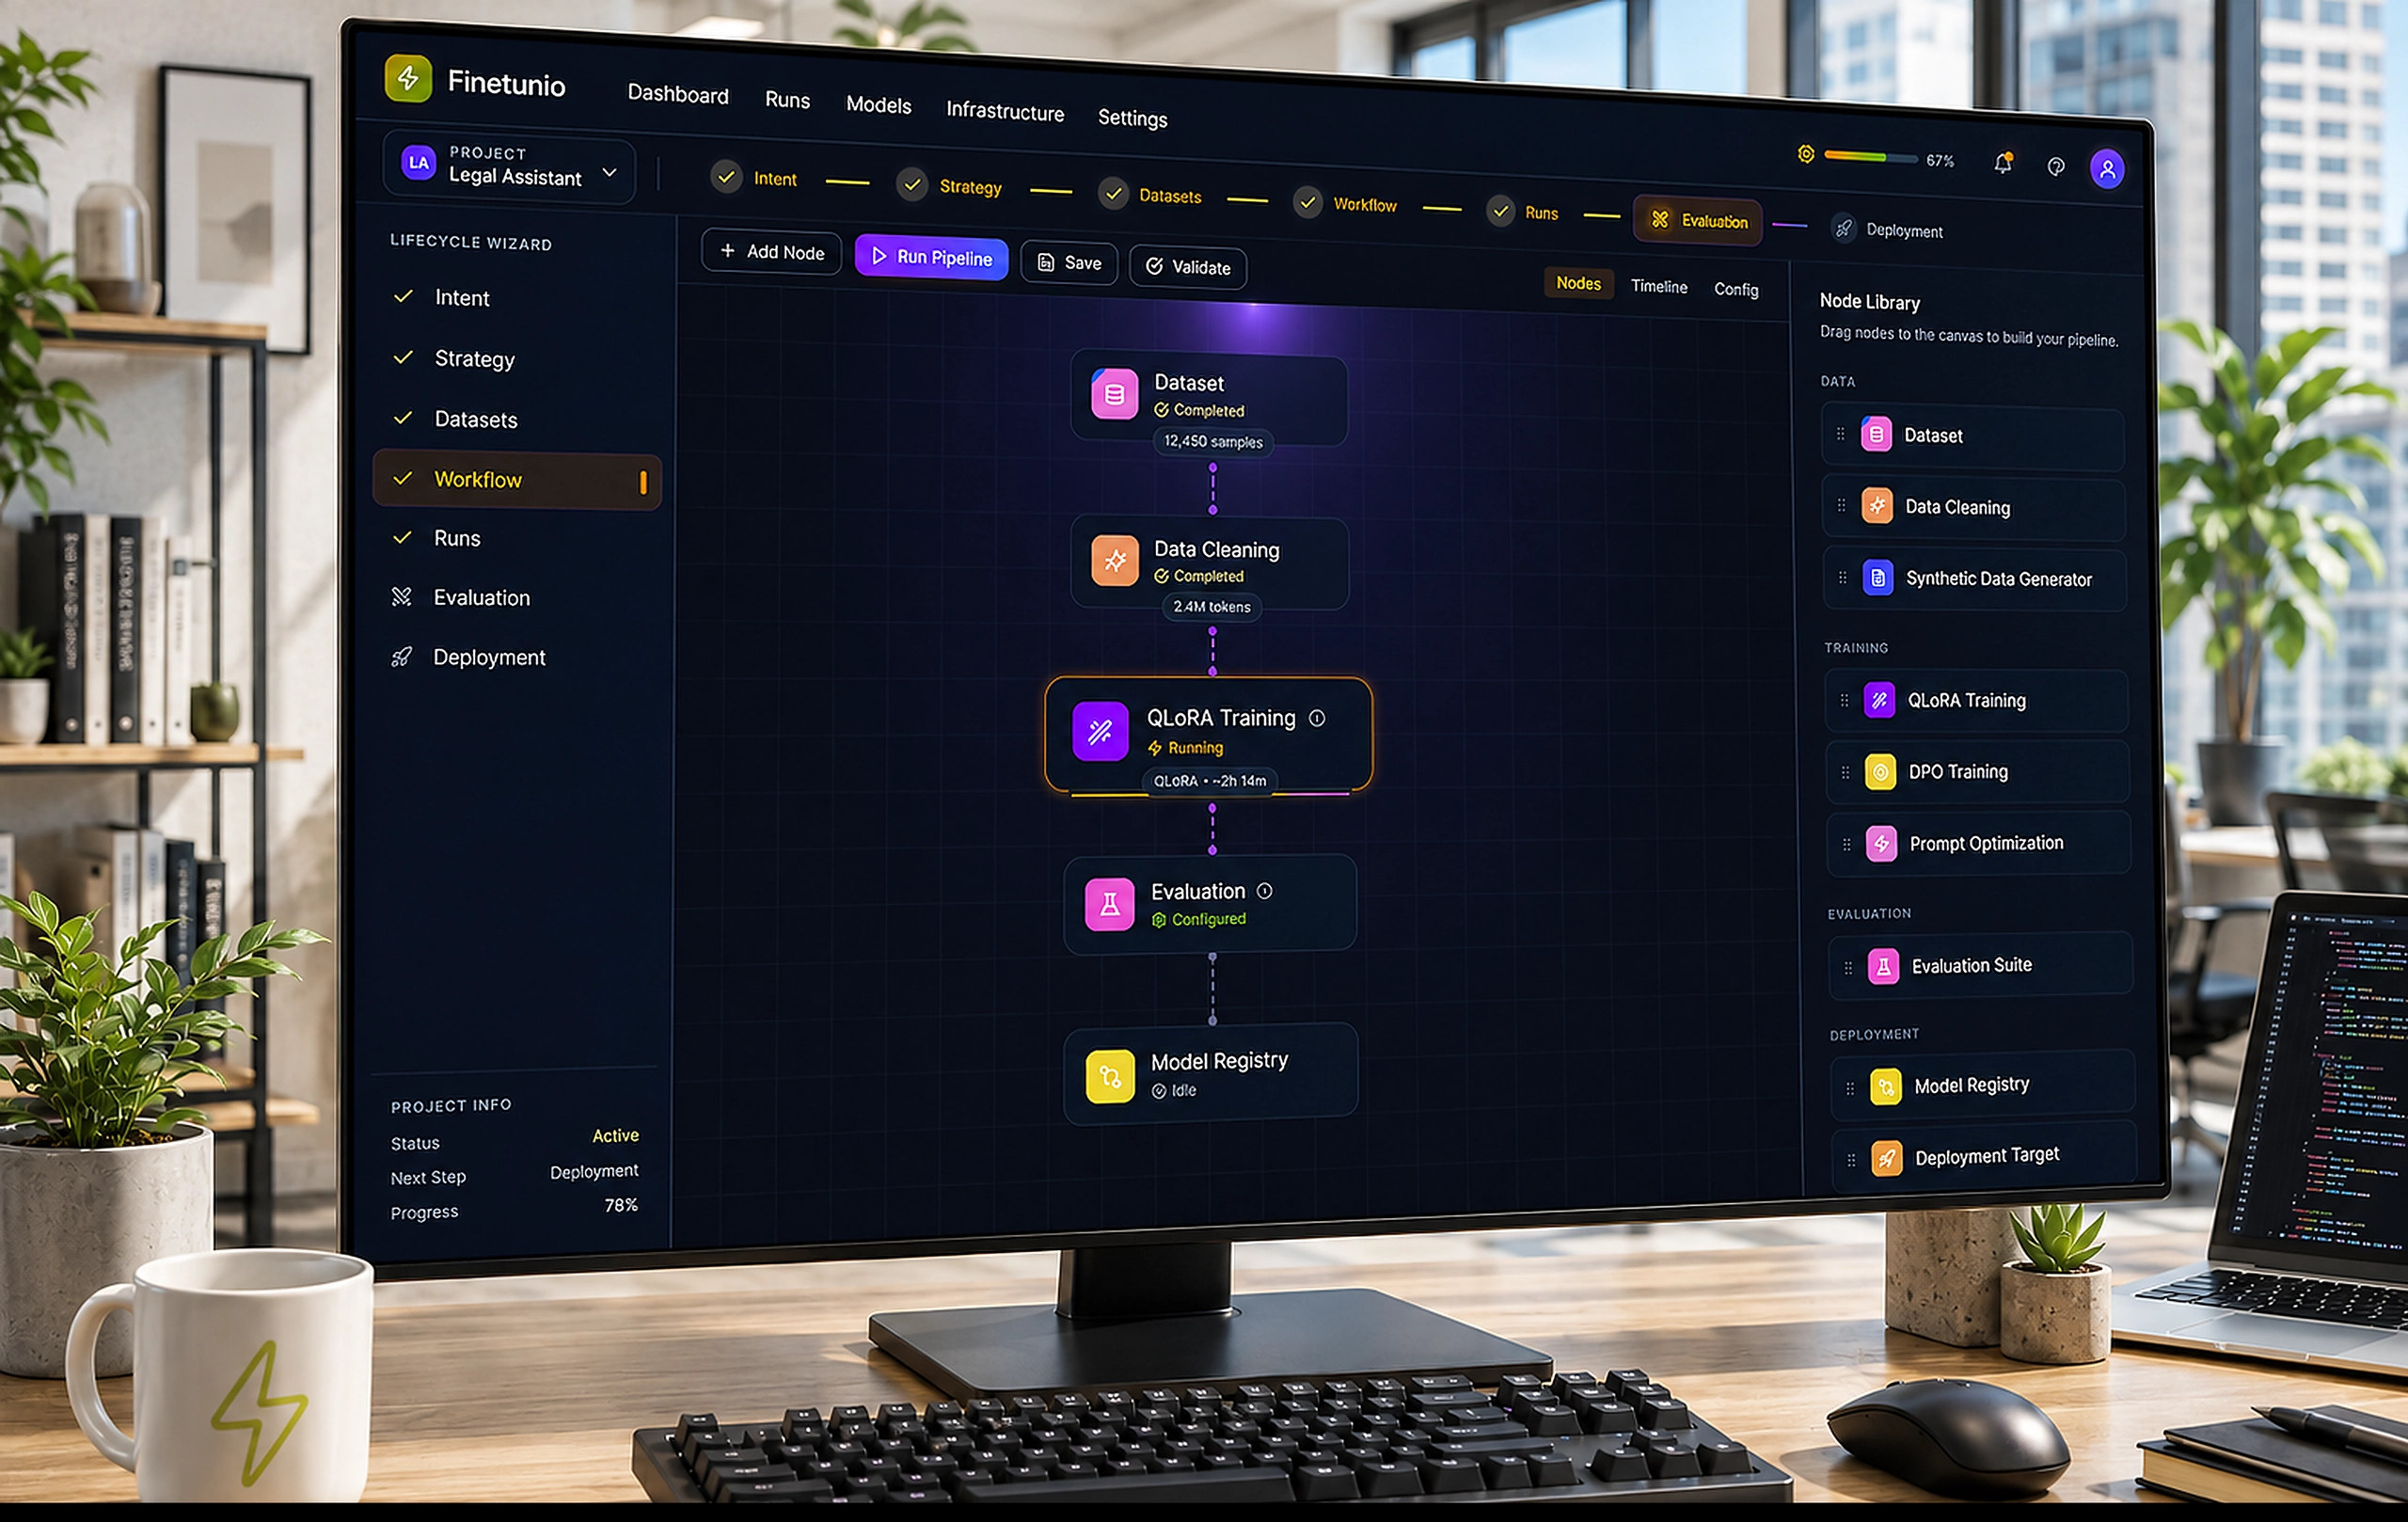
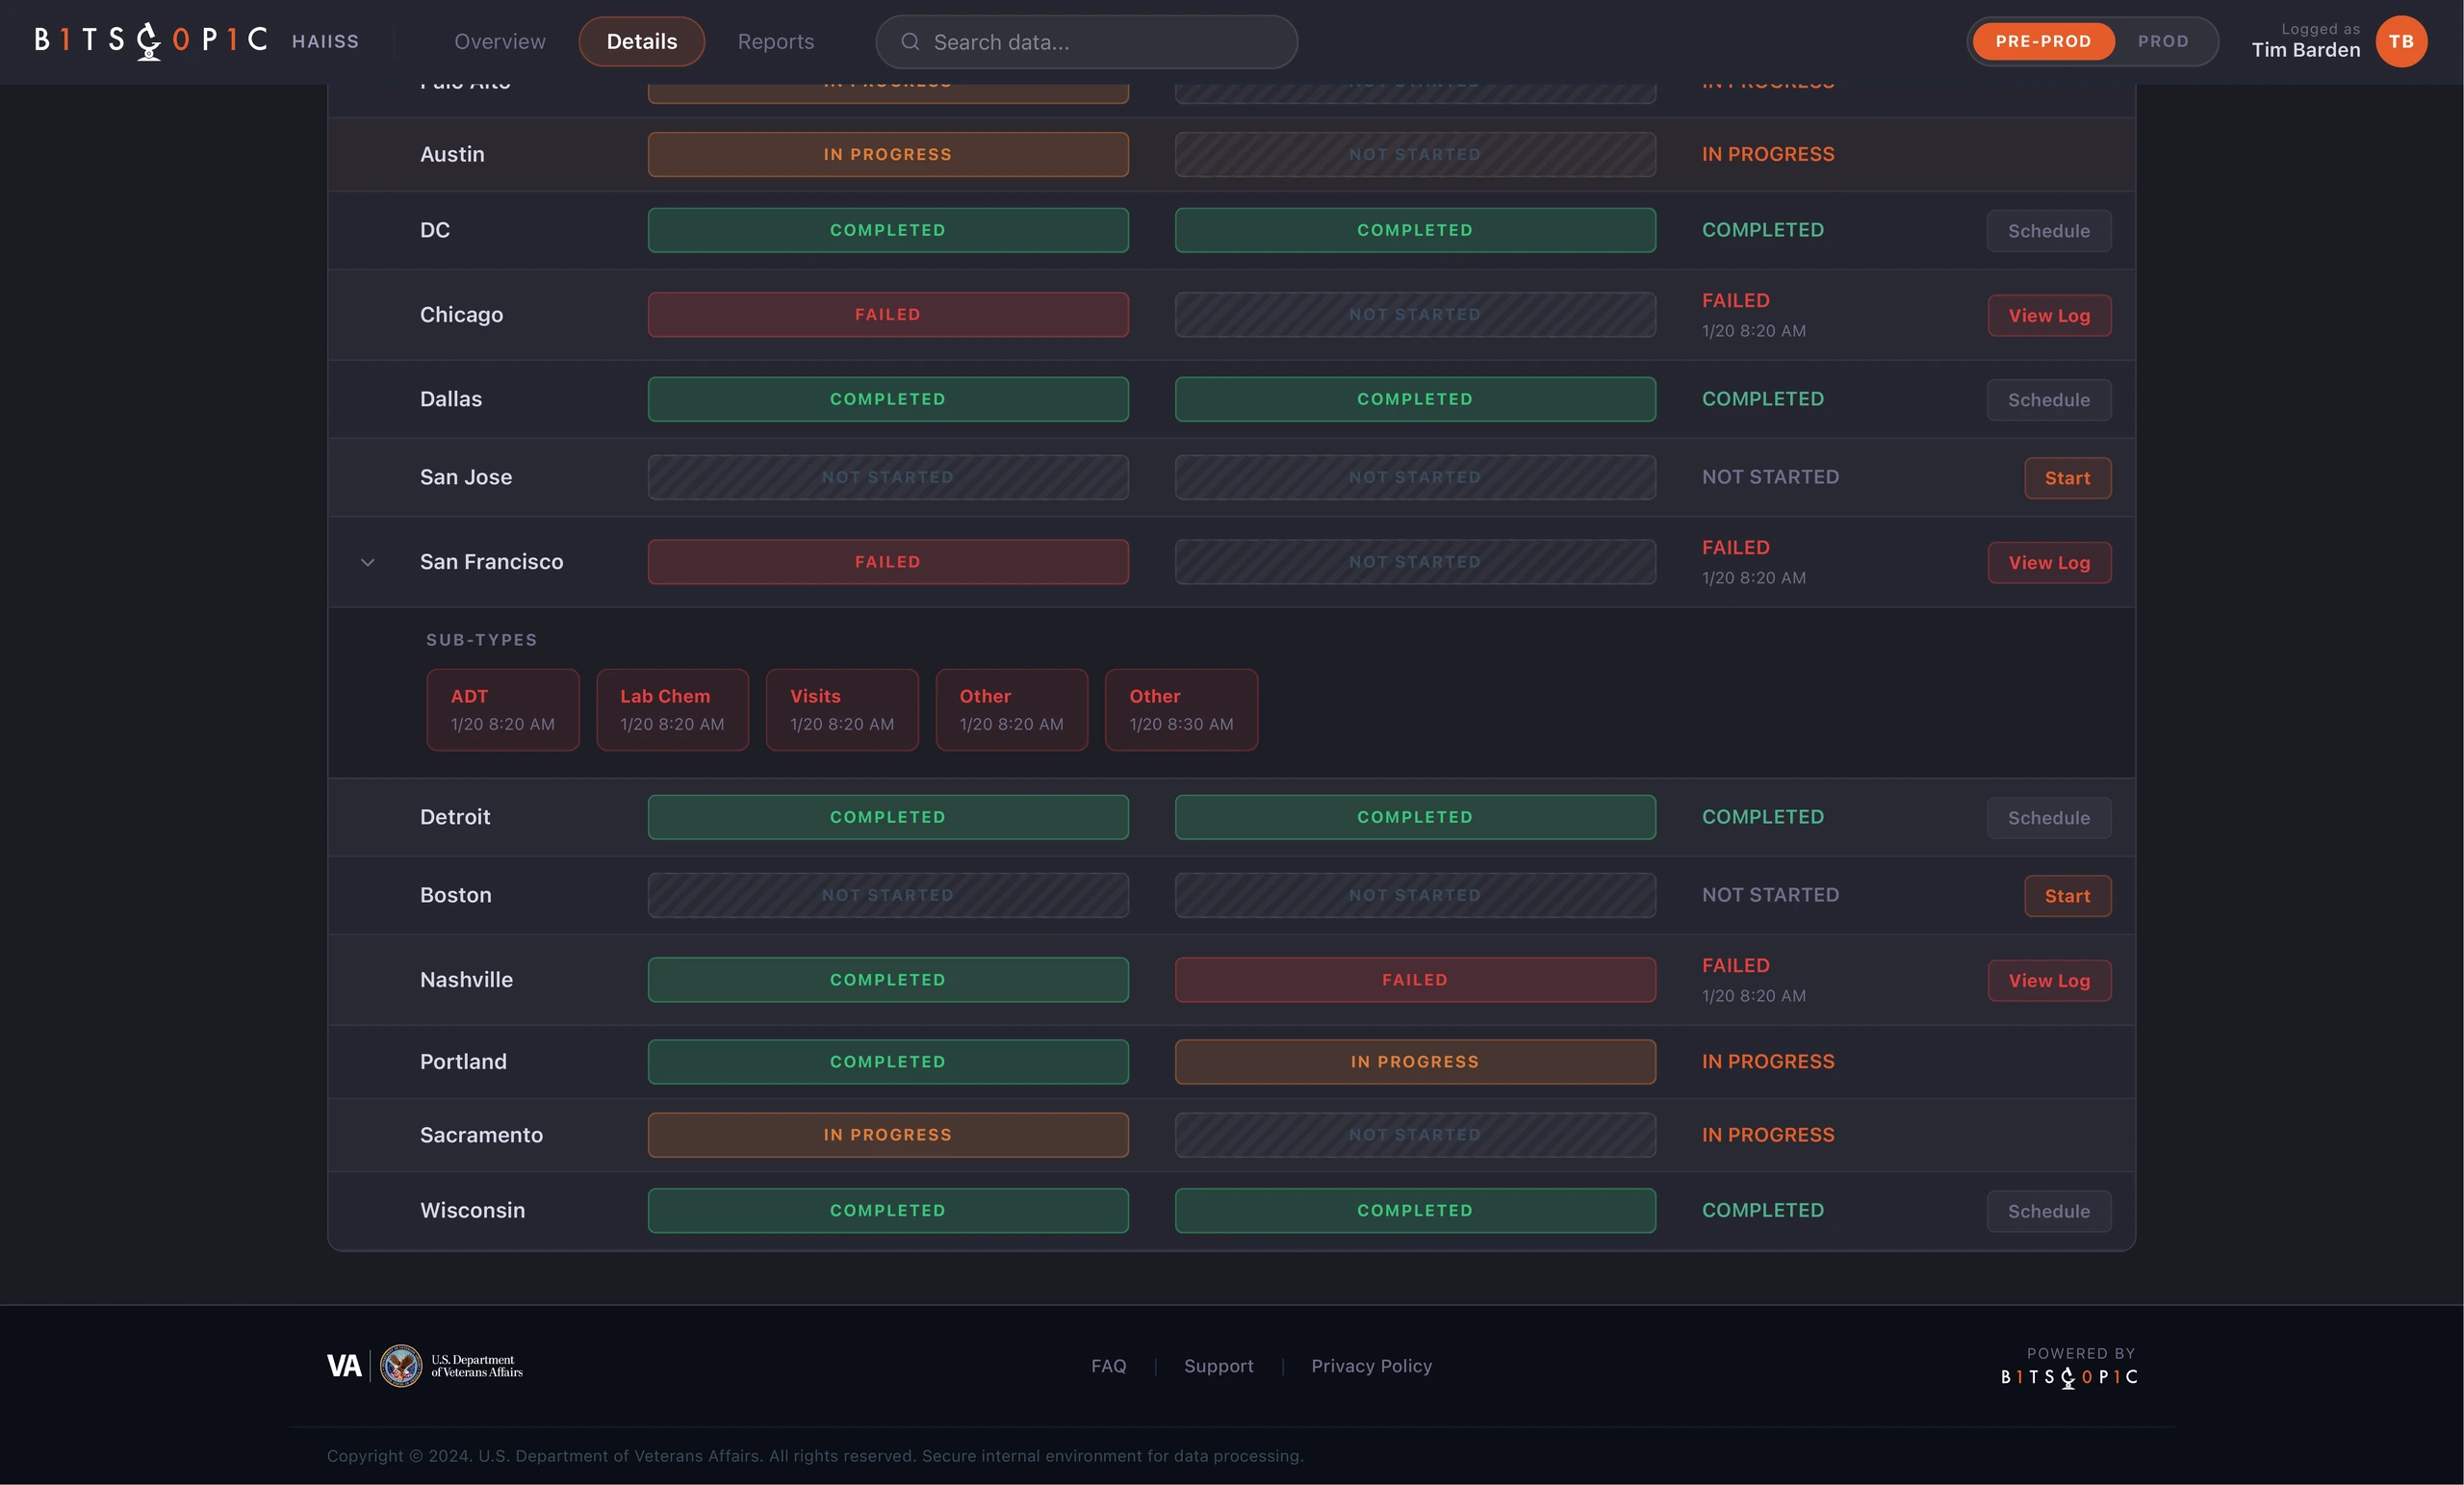
The Details view handled the deeper operational work. Sites were listed in a structured table, with extraction, ETL, overall status, and available actions presented side by side. This made it easier to compare locations and understand where a process had stopped. The status labels were intentionally blunt: Completed, In Progress, Failed, Not Started. In this context, clever language would have hurt clarity.
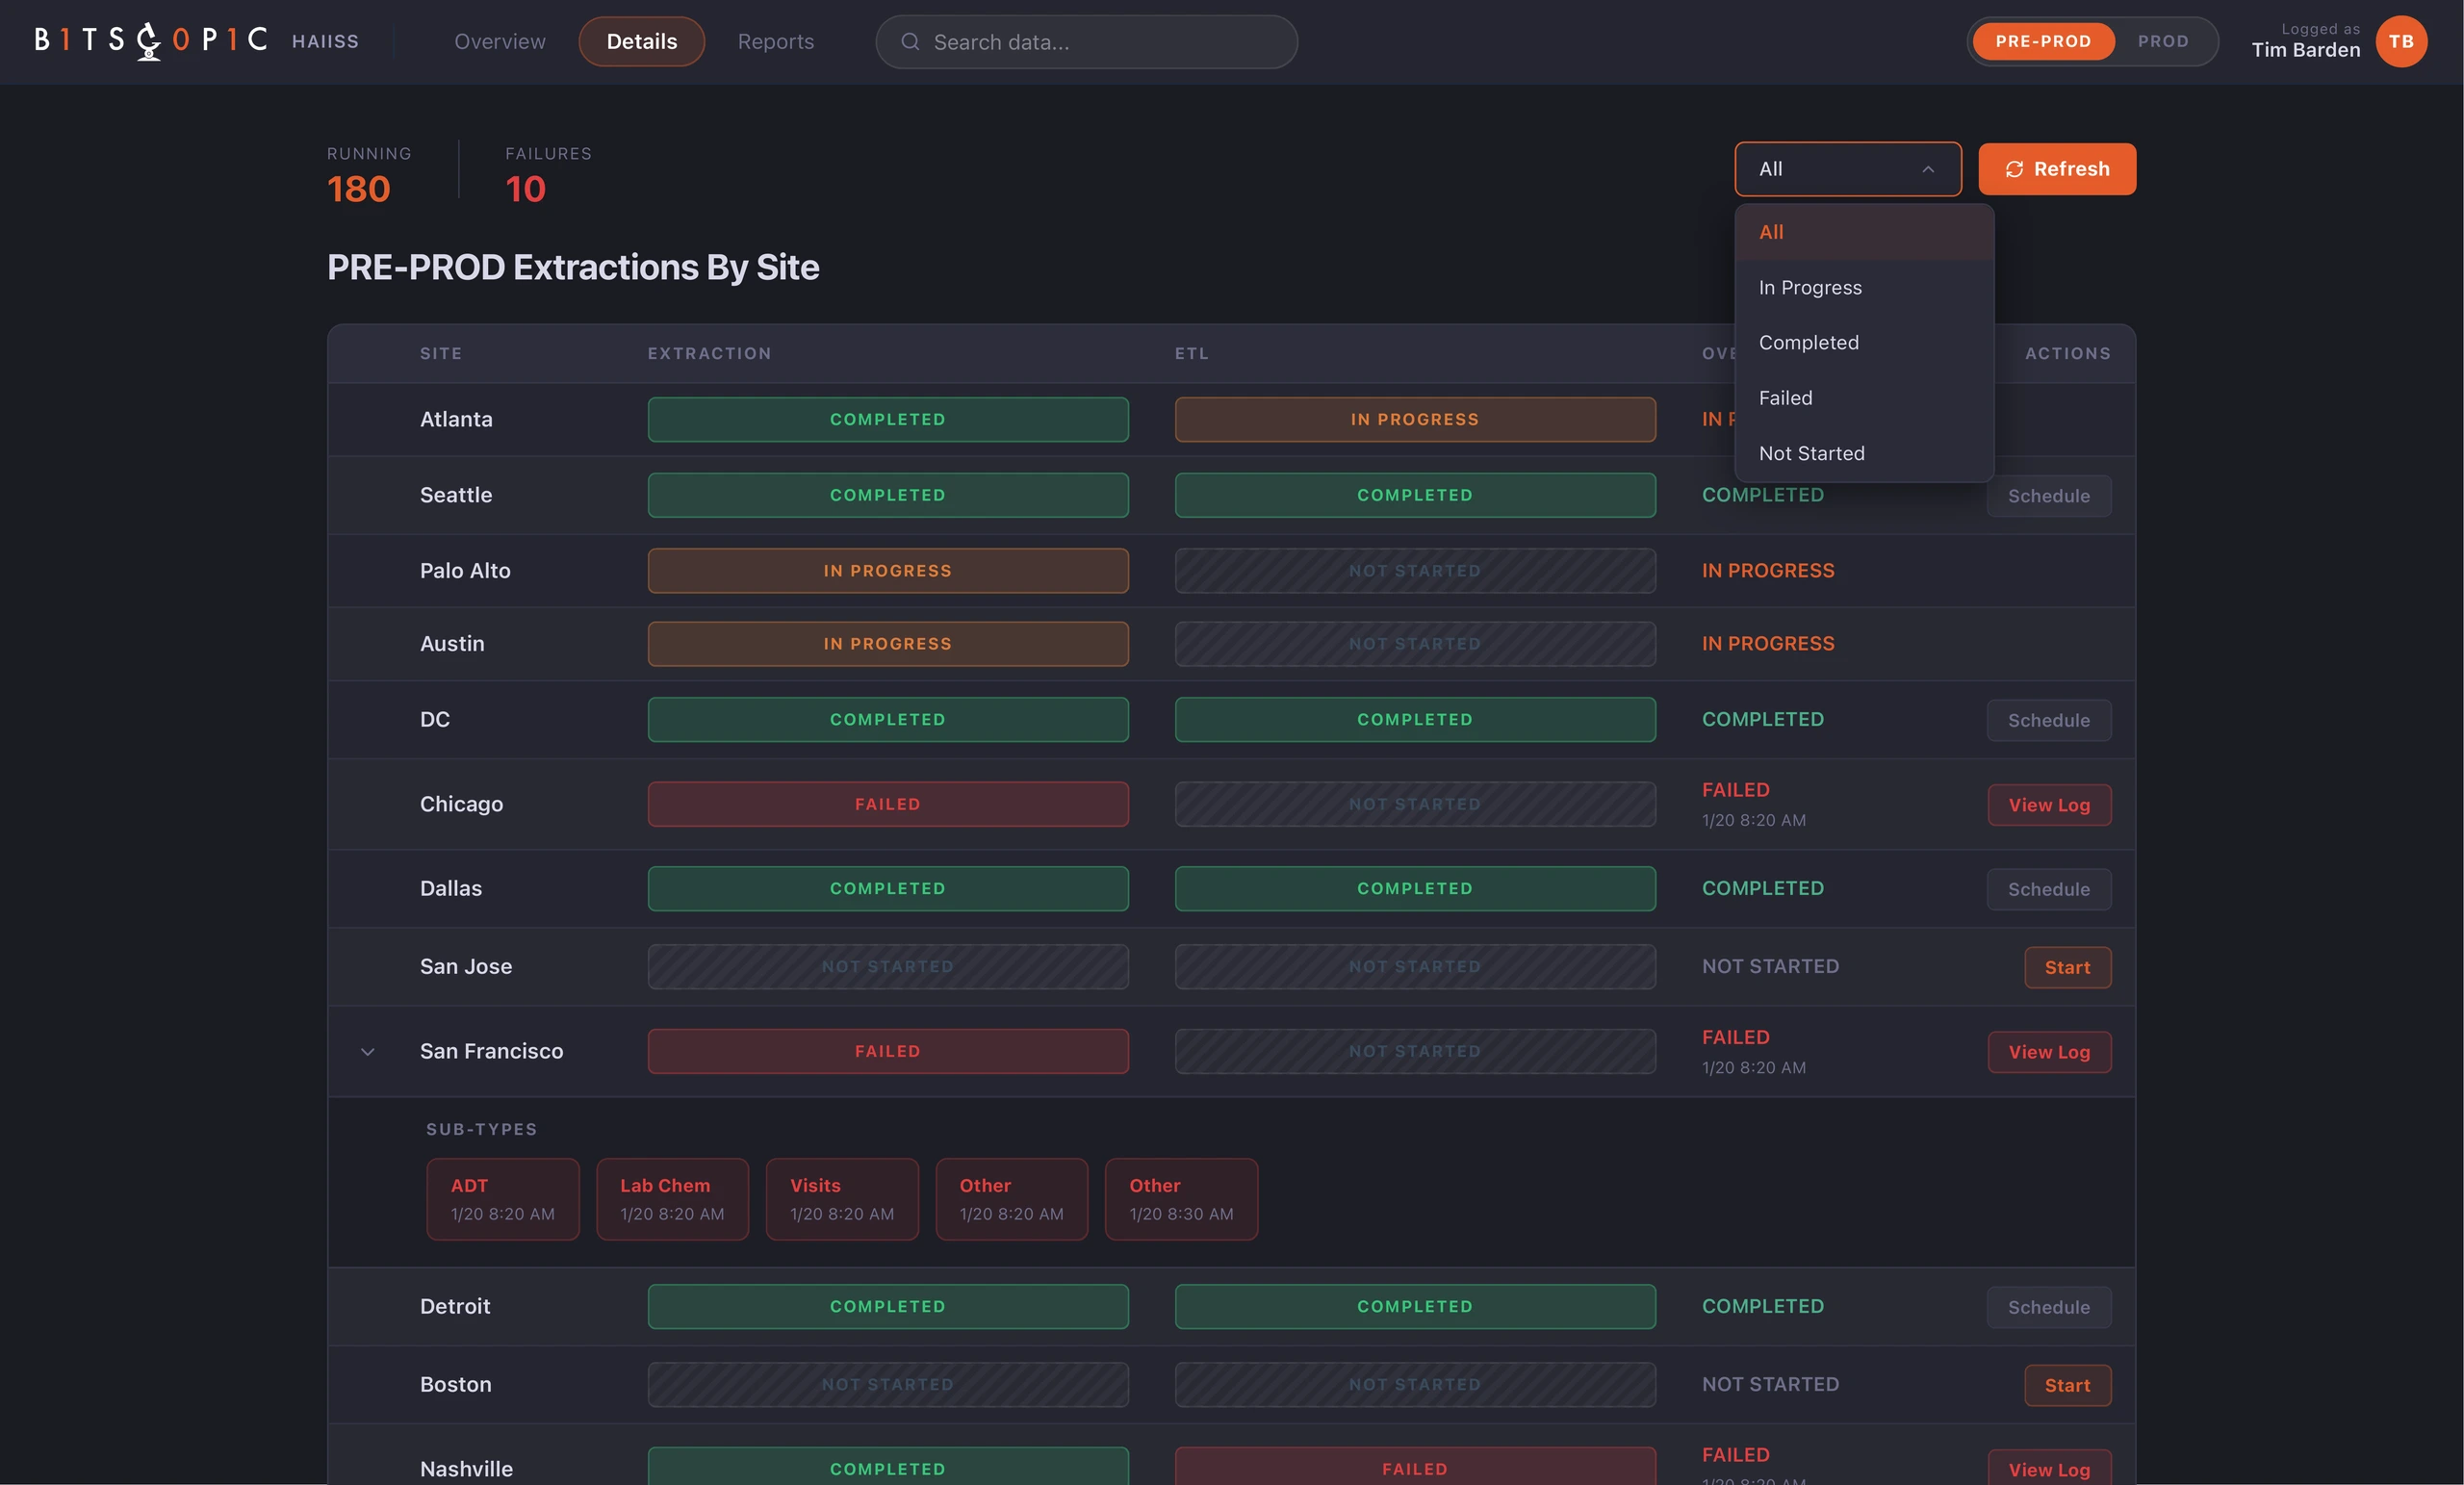
One important decision was to make failure expandable. A failed site was not always one simple event. It could contain multiple failed sub-types, each with its own timestamp and operational meaning. By exposing those sub-types inside the row, the interface let users investigate without leaving the table or losing context.
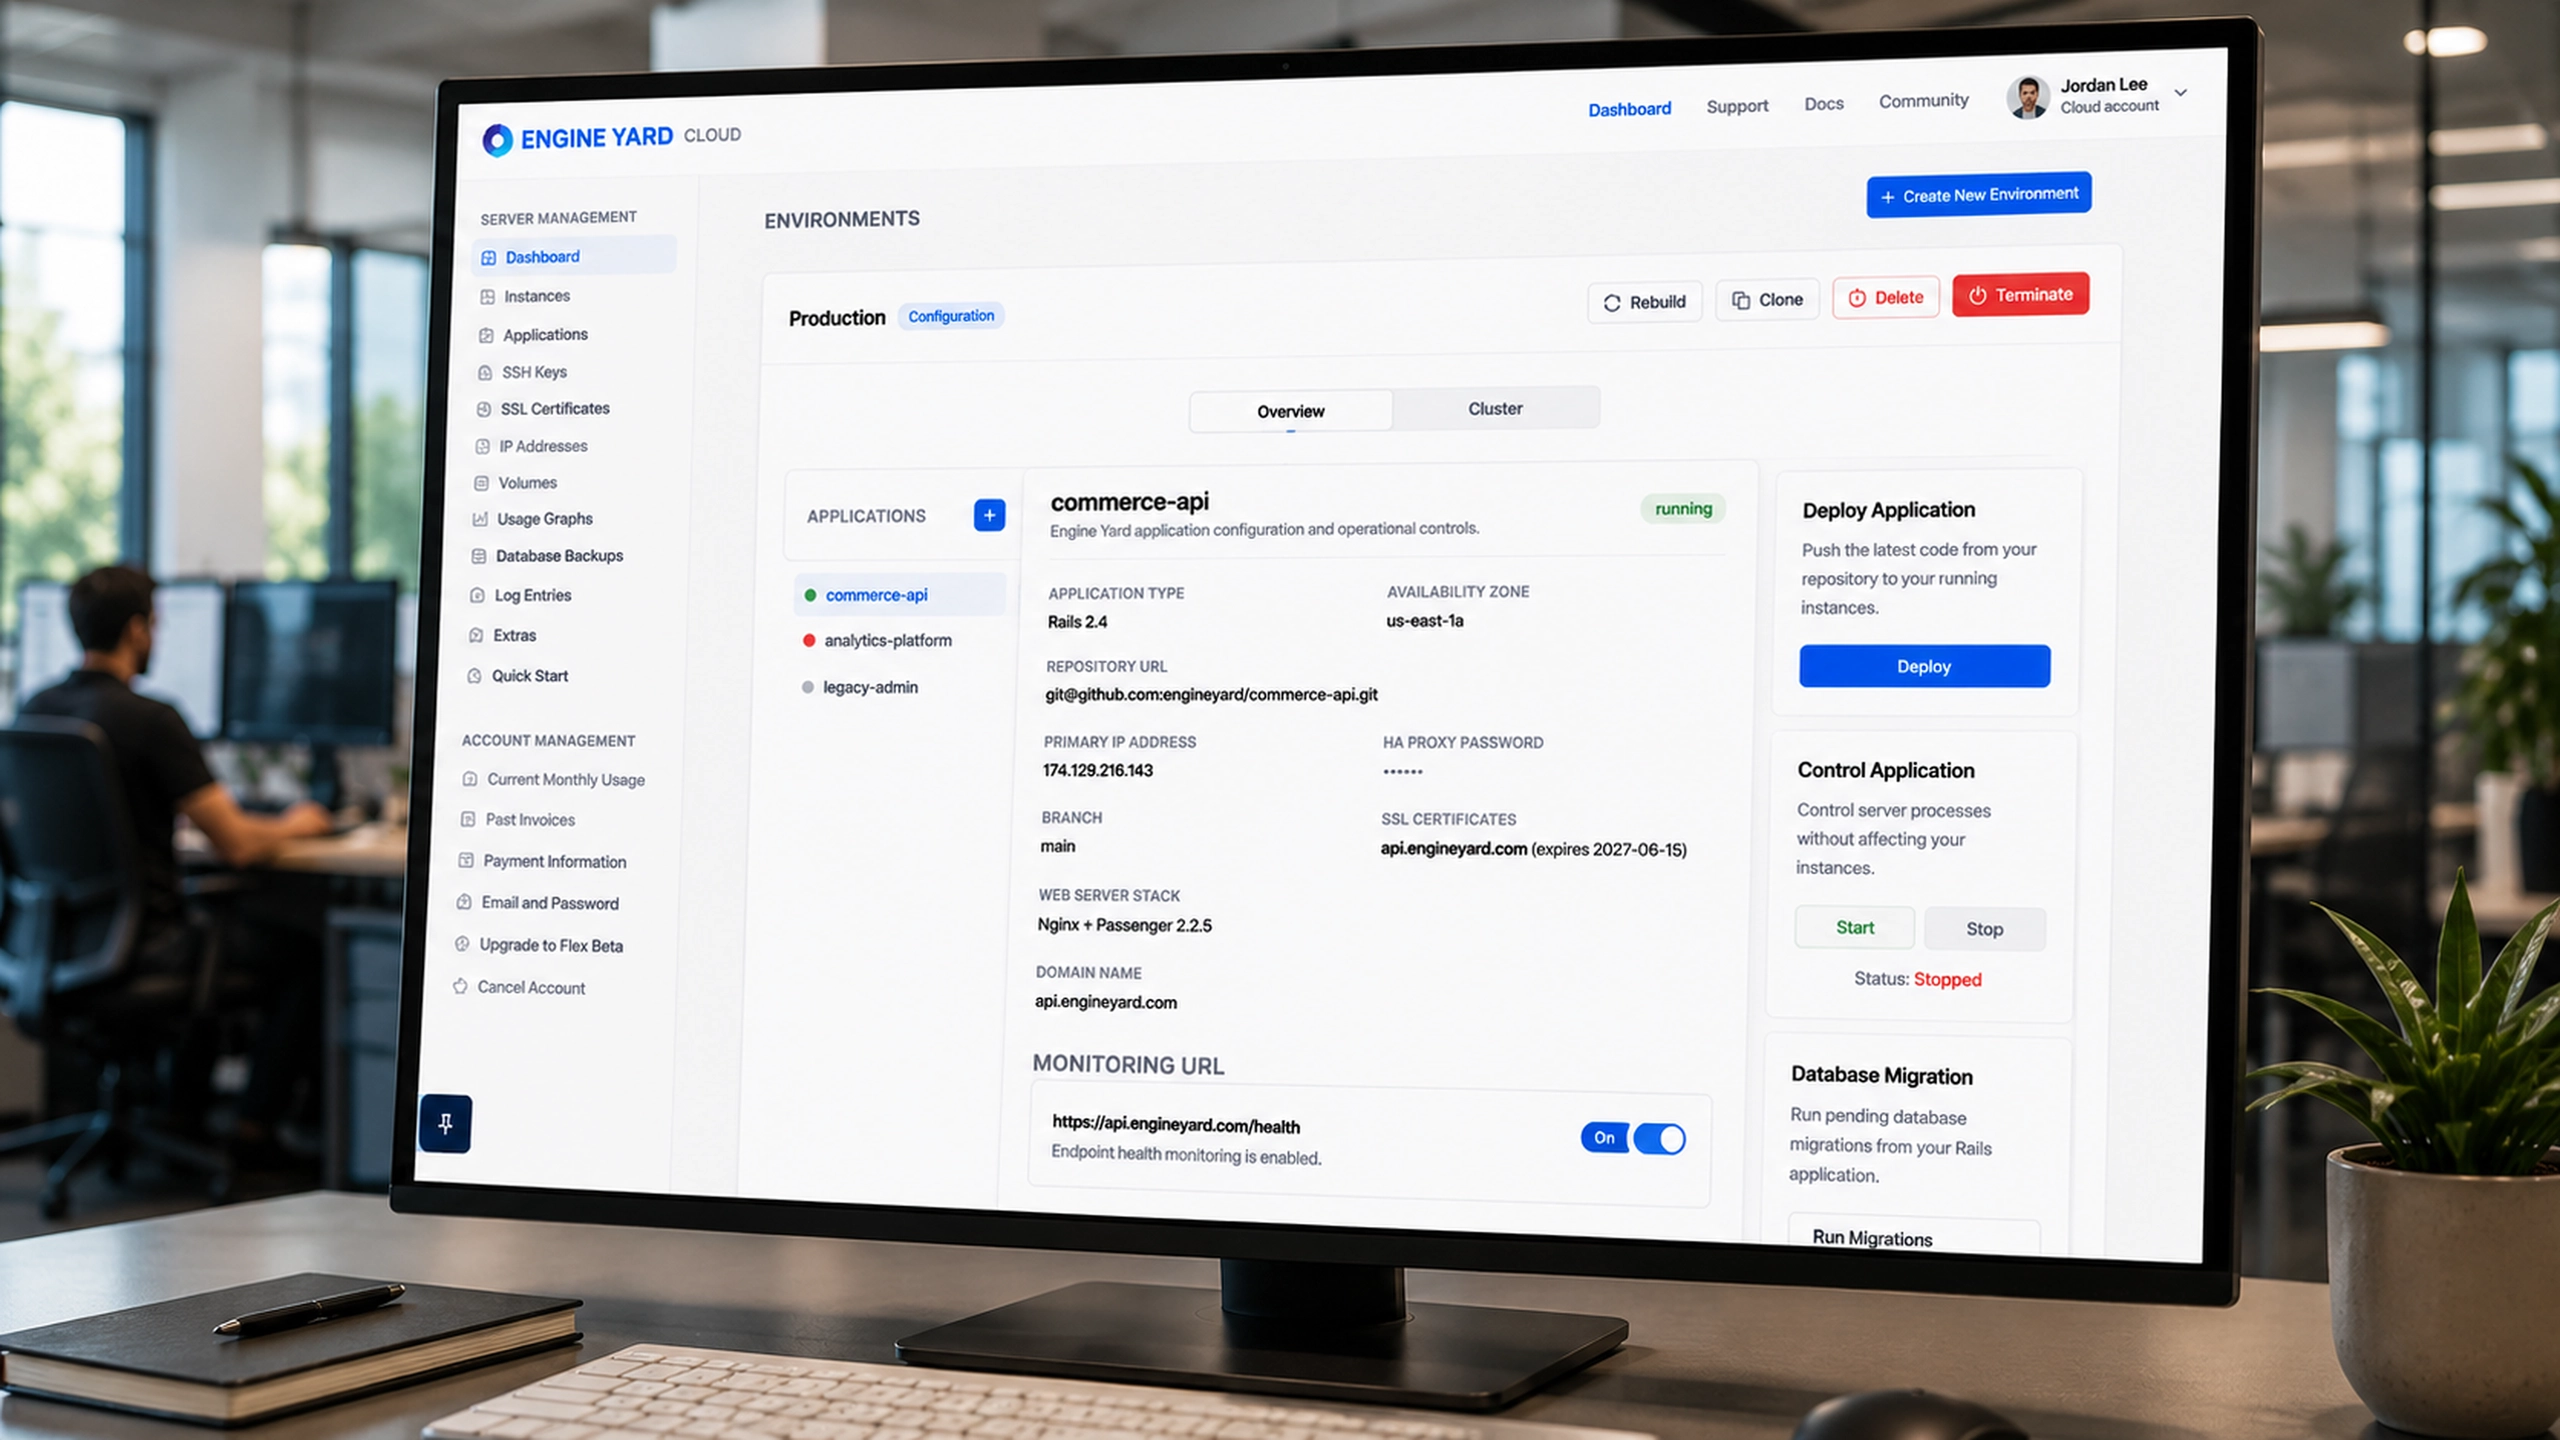
Filtering was also critical. A table with every site is useful only when users can narrow it to the current question. The status filter turned the Details page into a triage tool: show me everything, show me failures, show me what is still running, show me what has not started. That kept the interface useful during calm monitoring and urgent investigation.

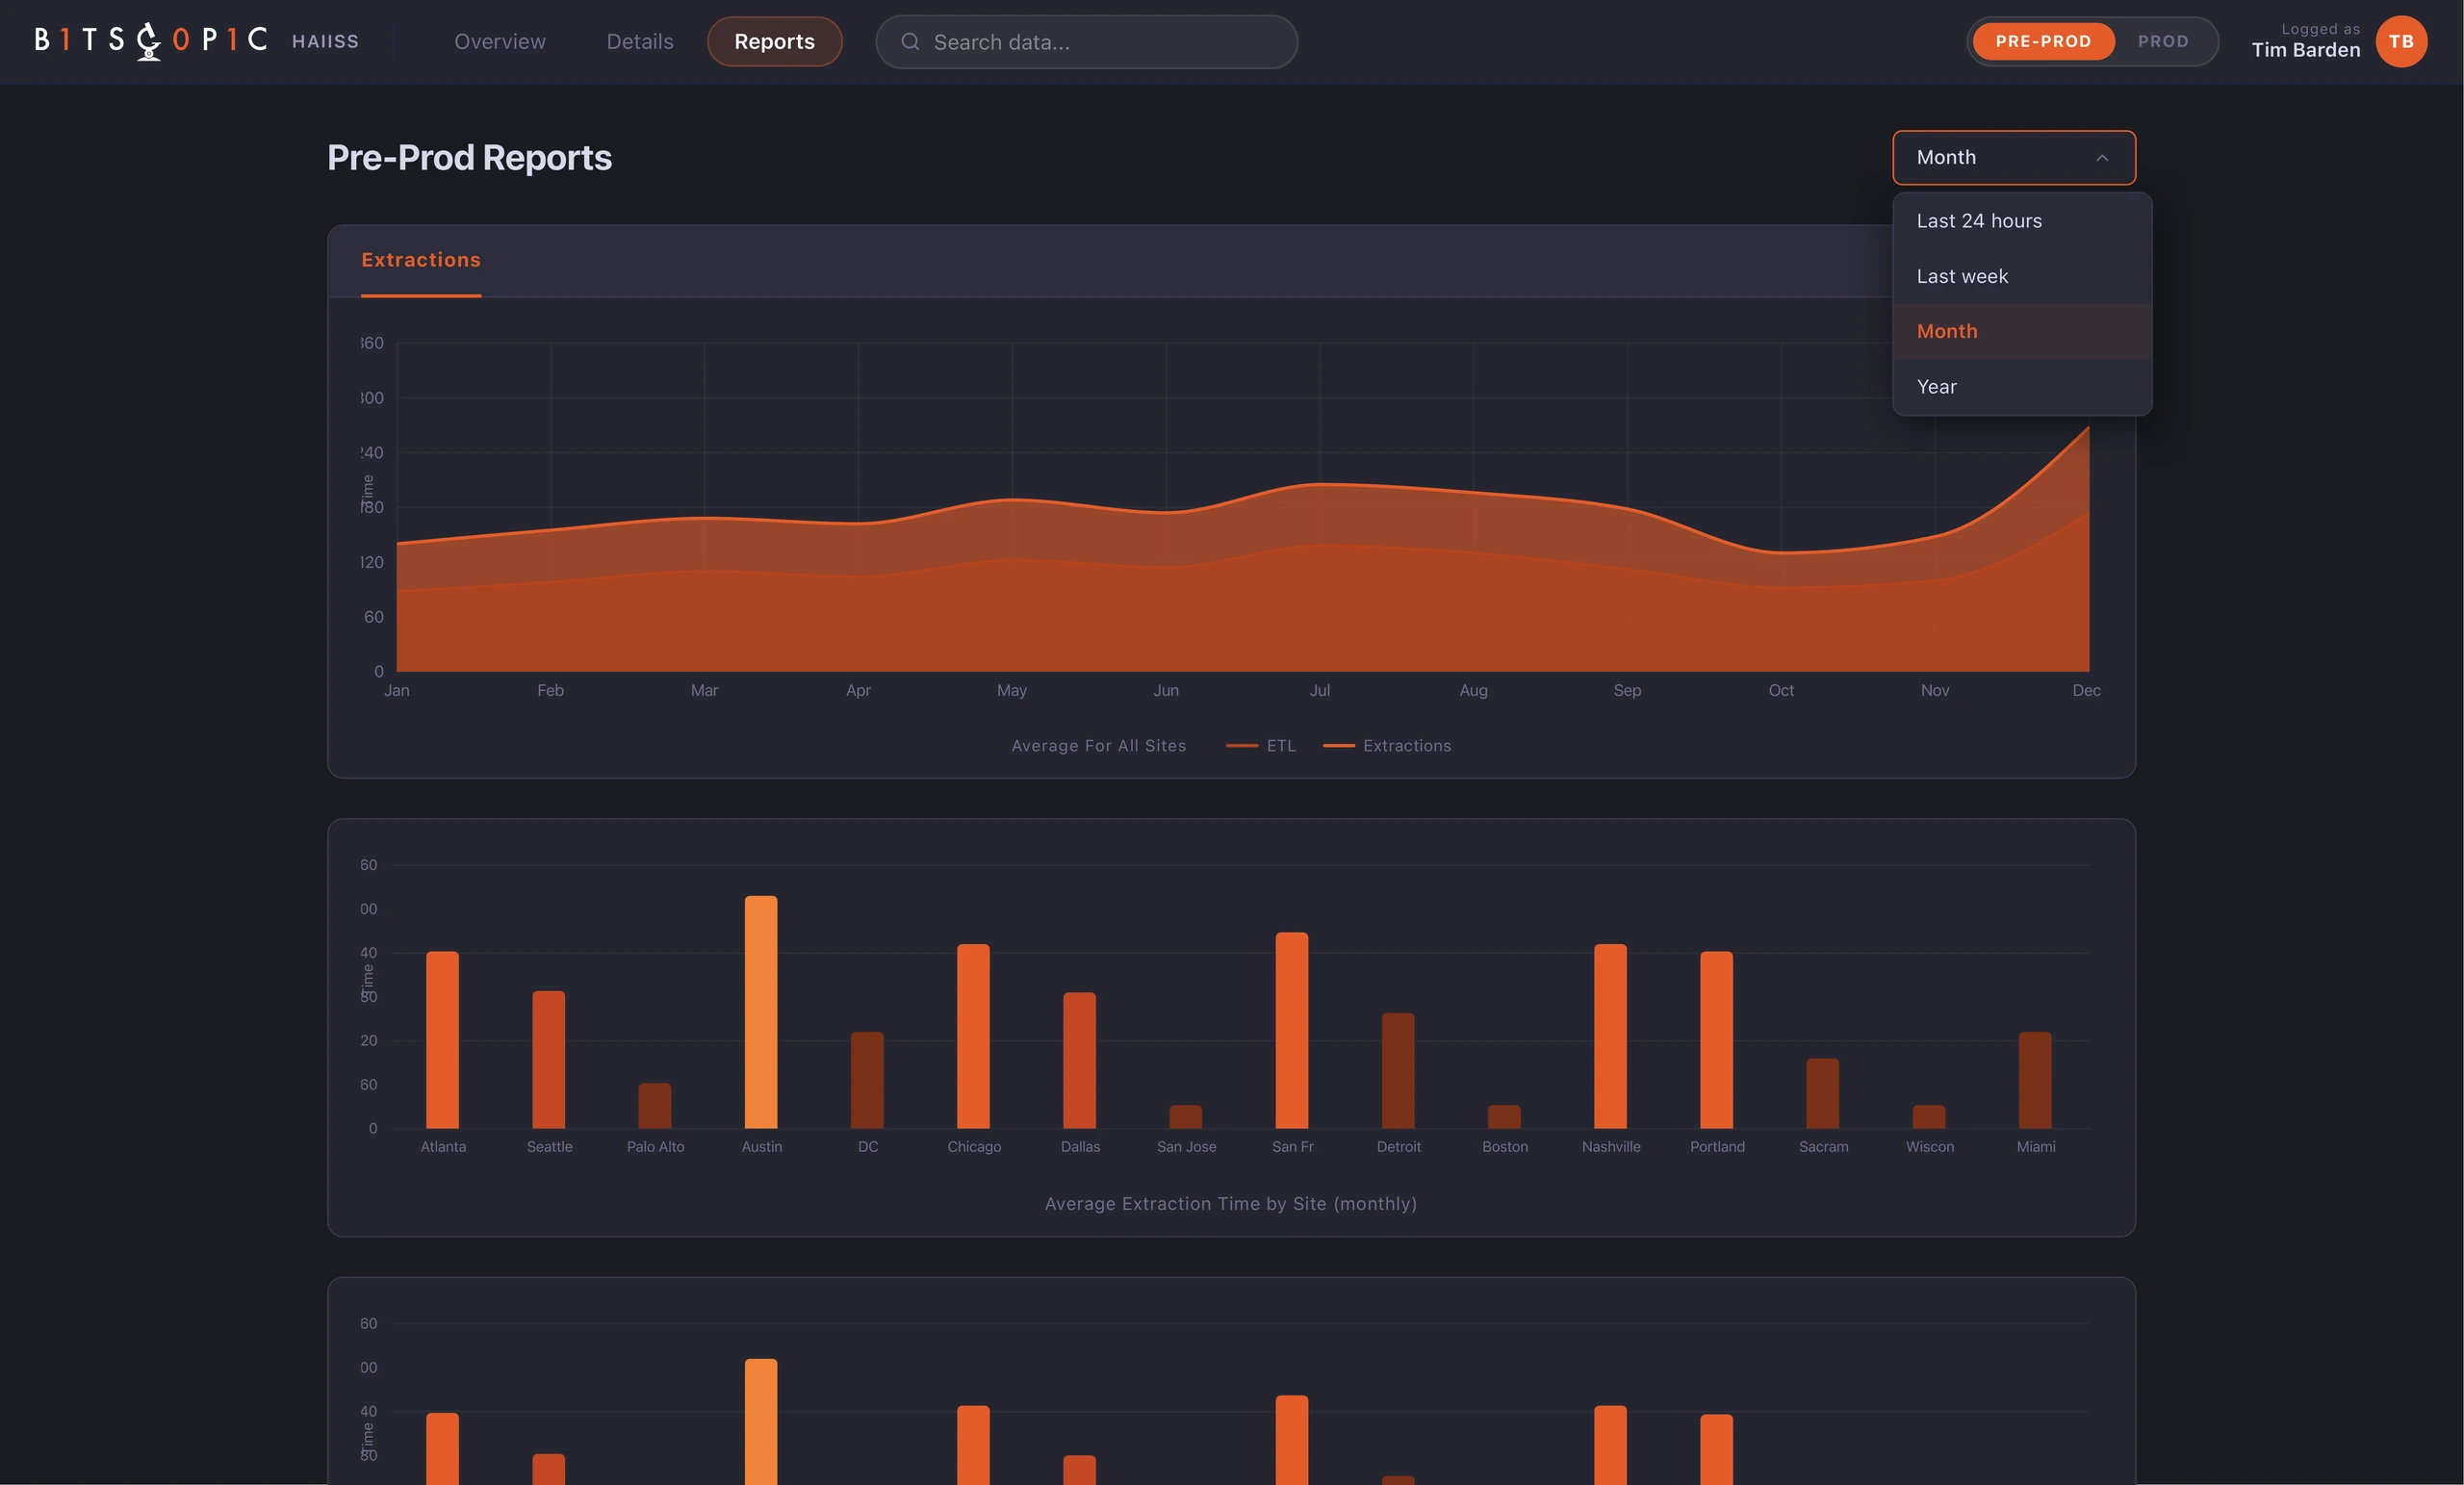
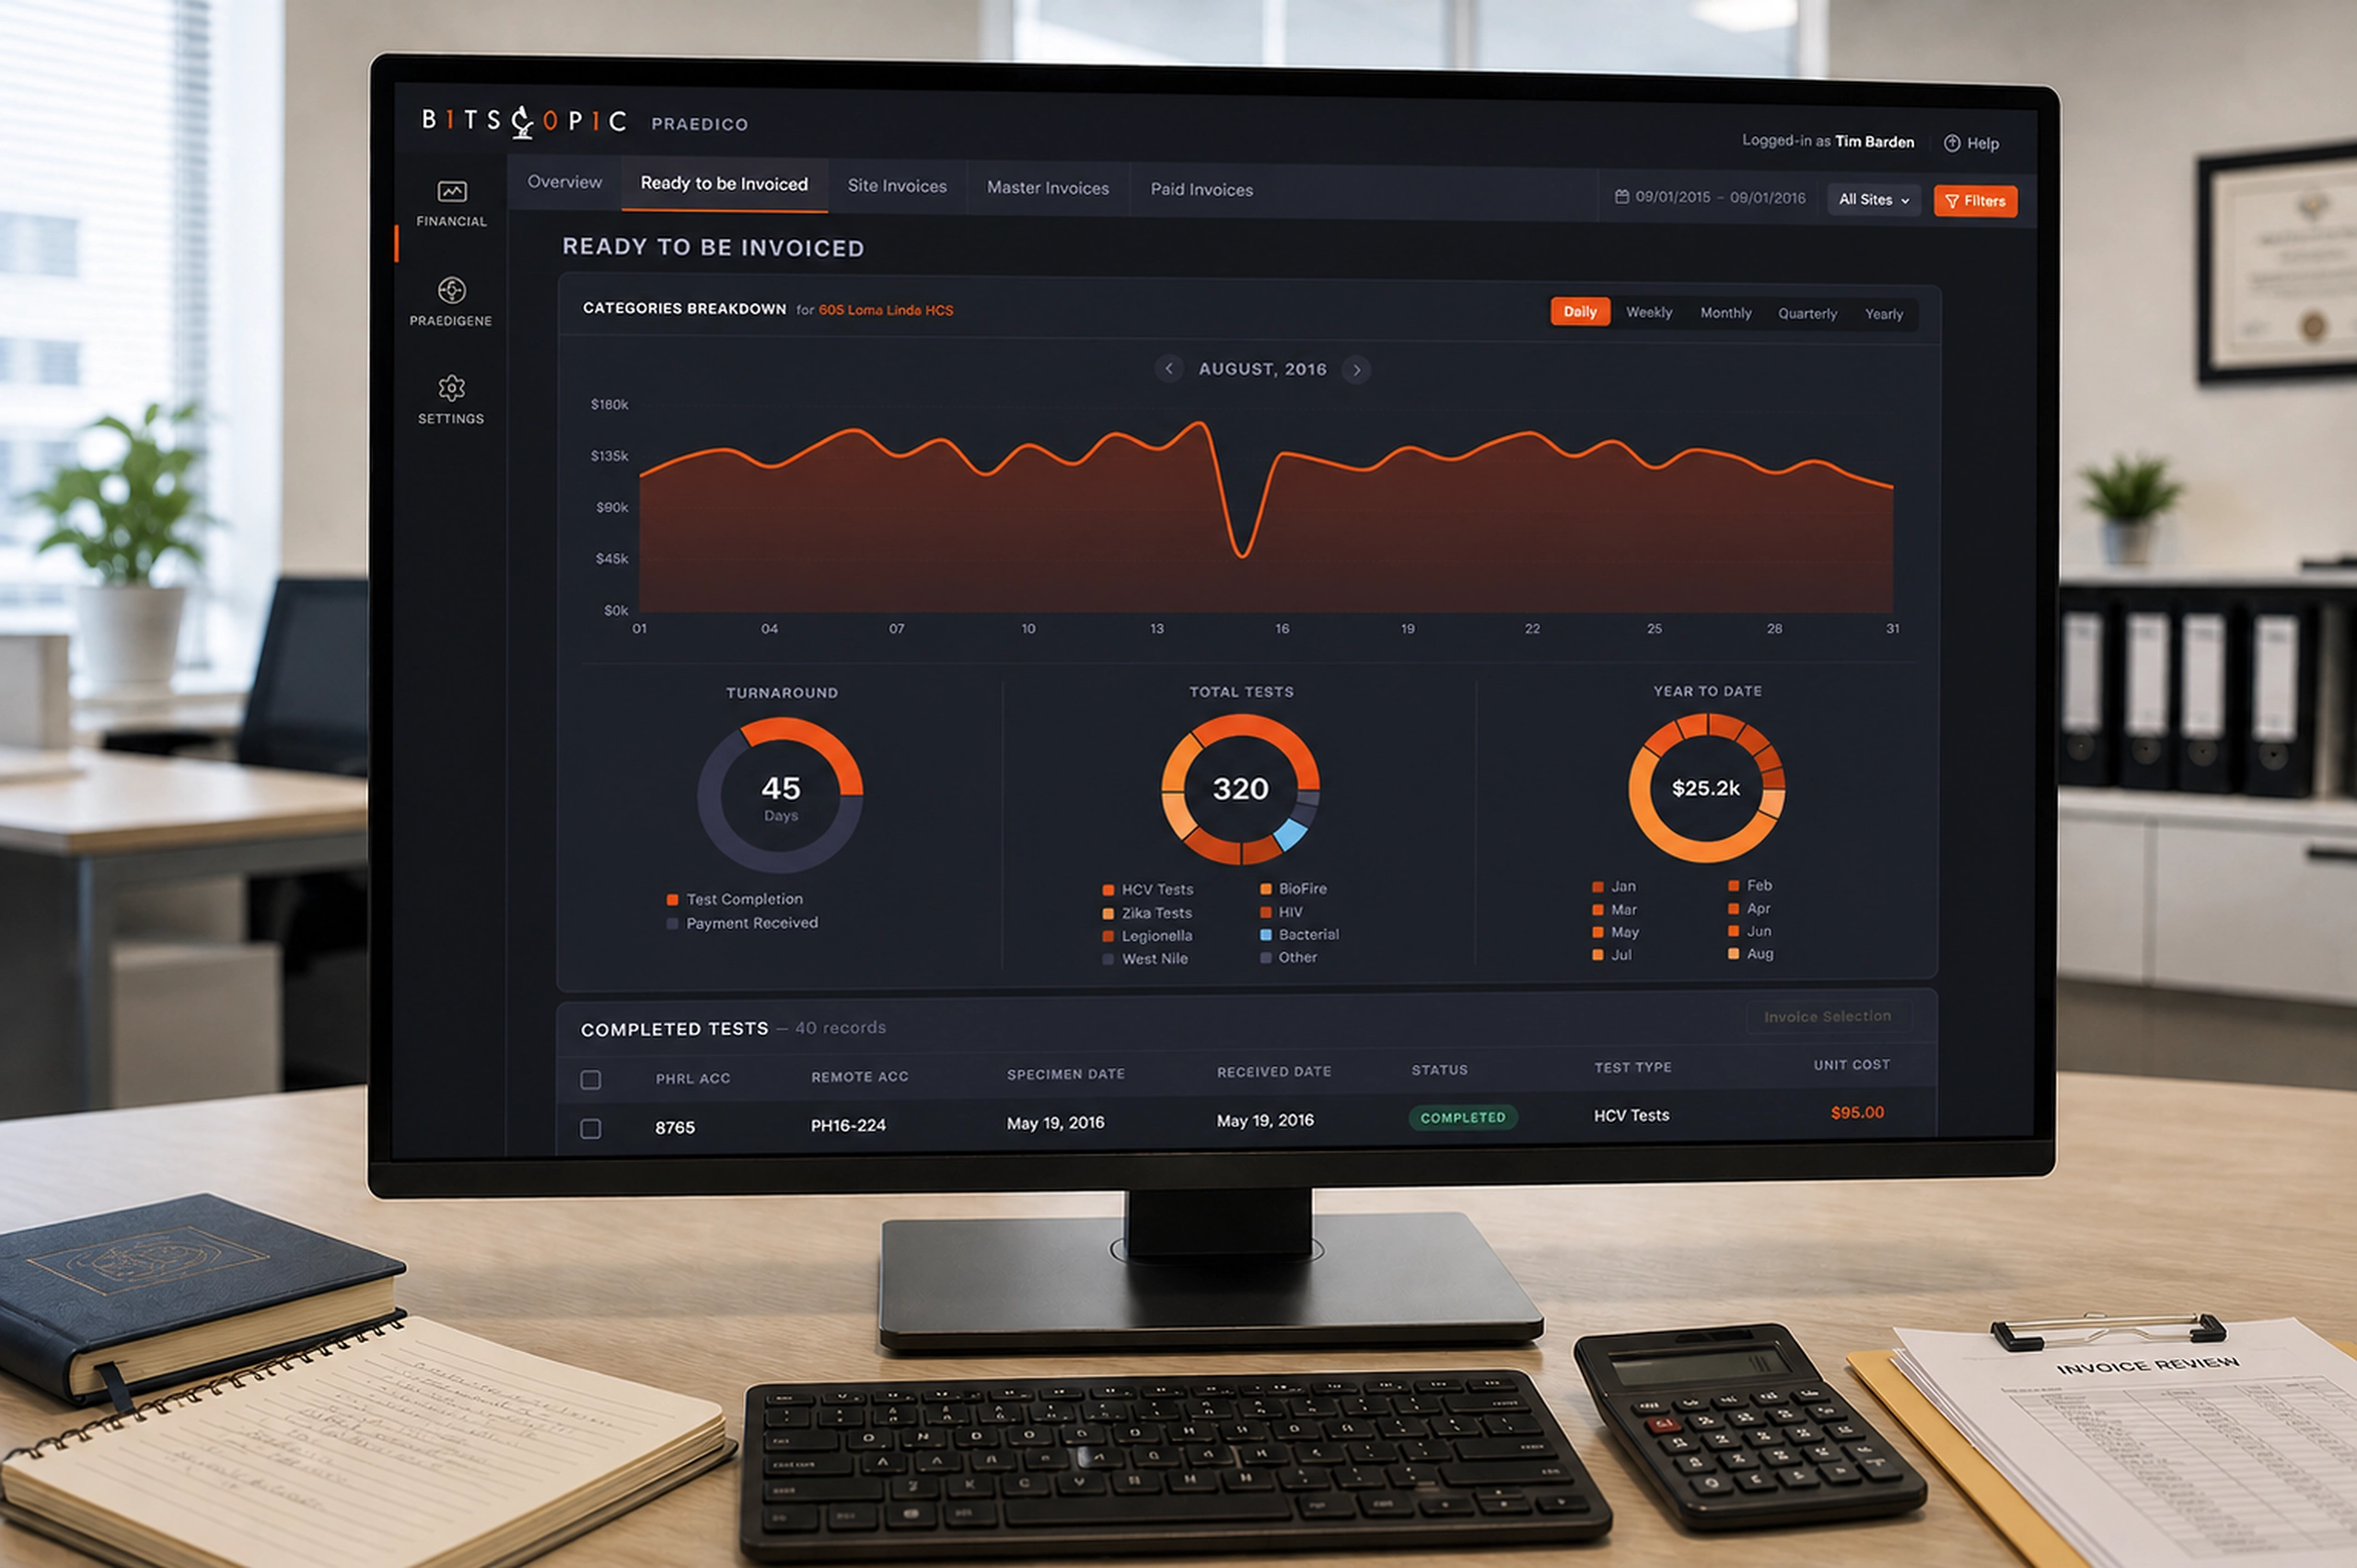
The Reports section extended the product beyond real-time status. Once teams could see the current system state, they also needed to understand patterns over time: extraction volume, average times by site, and ETL performance. I kept the reporting UI visually consistent with the monitoring screens so the product felt like one operational system, not separate dashboards stitched together.