Clients & Ventures
Product/systems design that turns AI tech into business results


Contact Us
Contact form or information will go here.
Project Detail

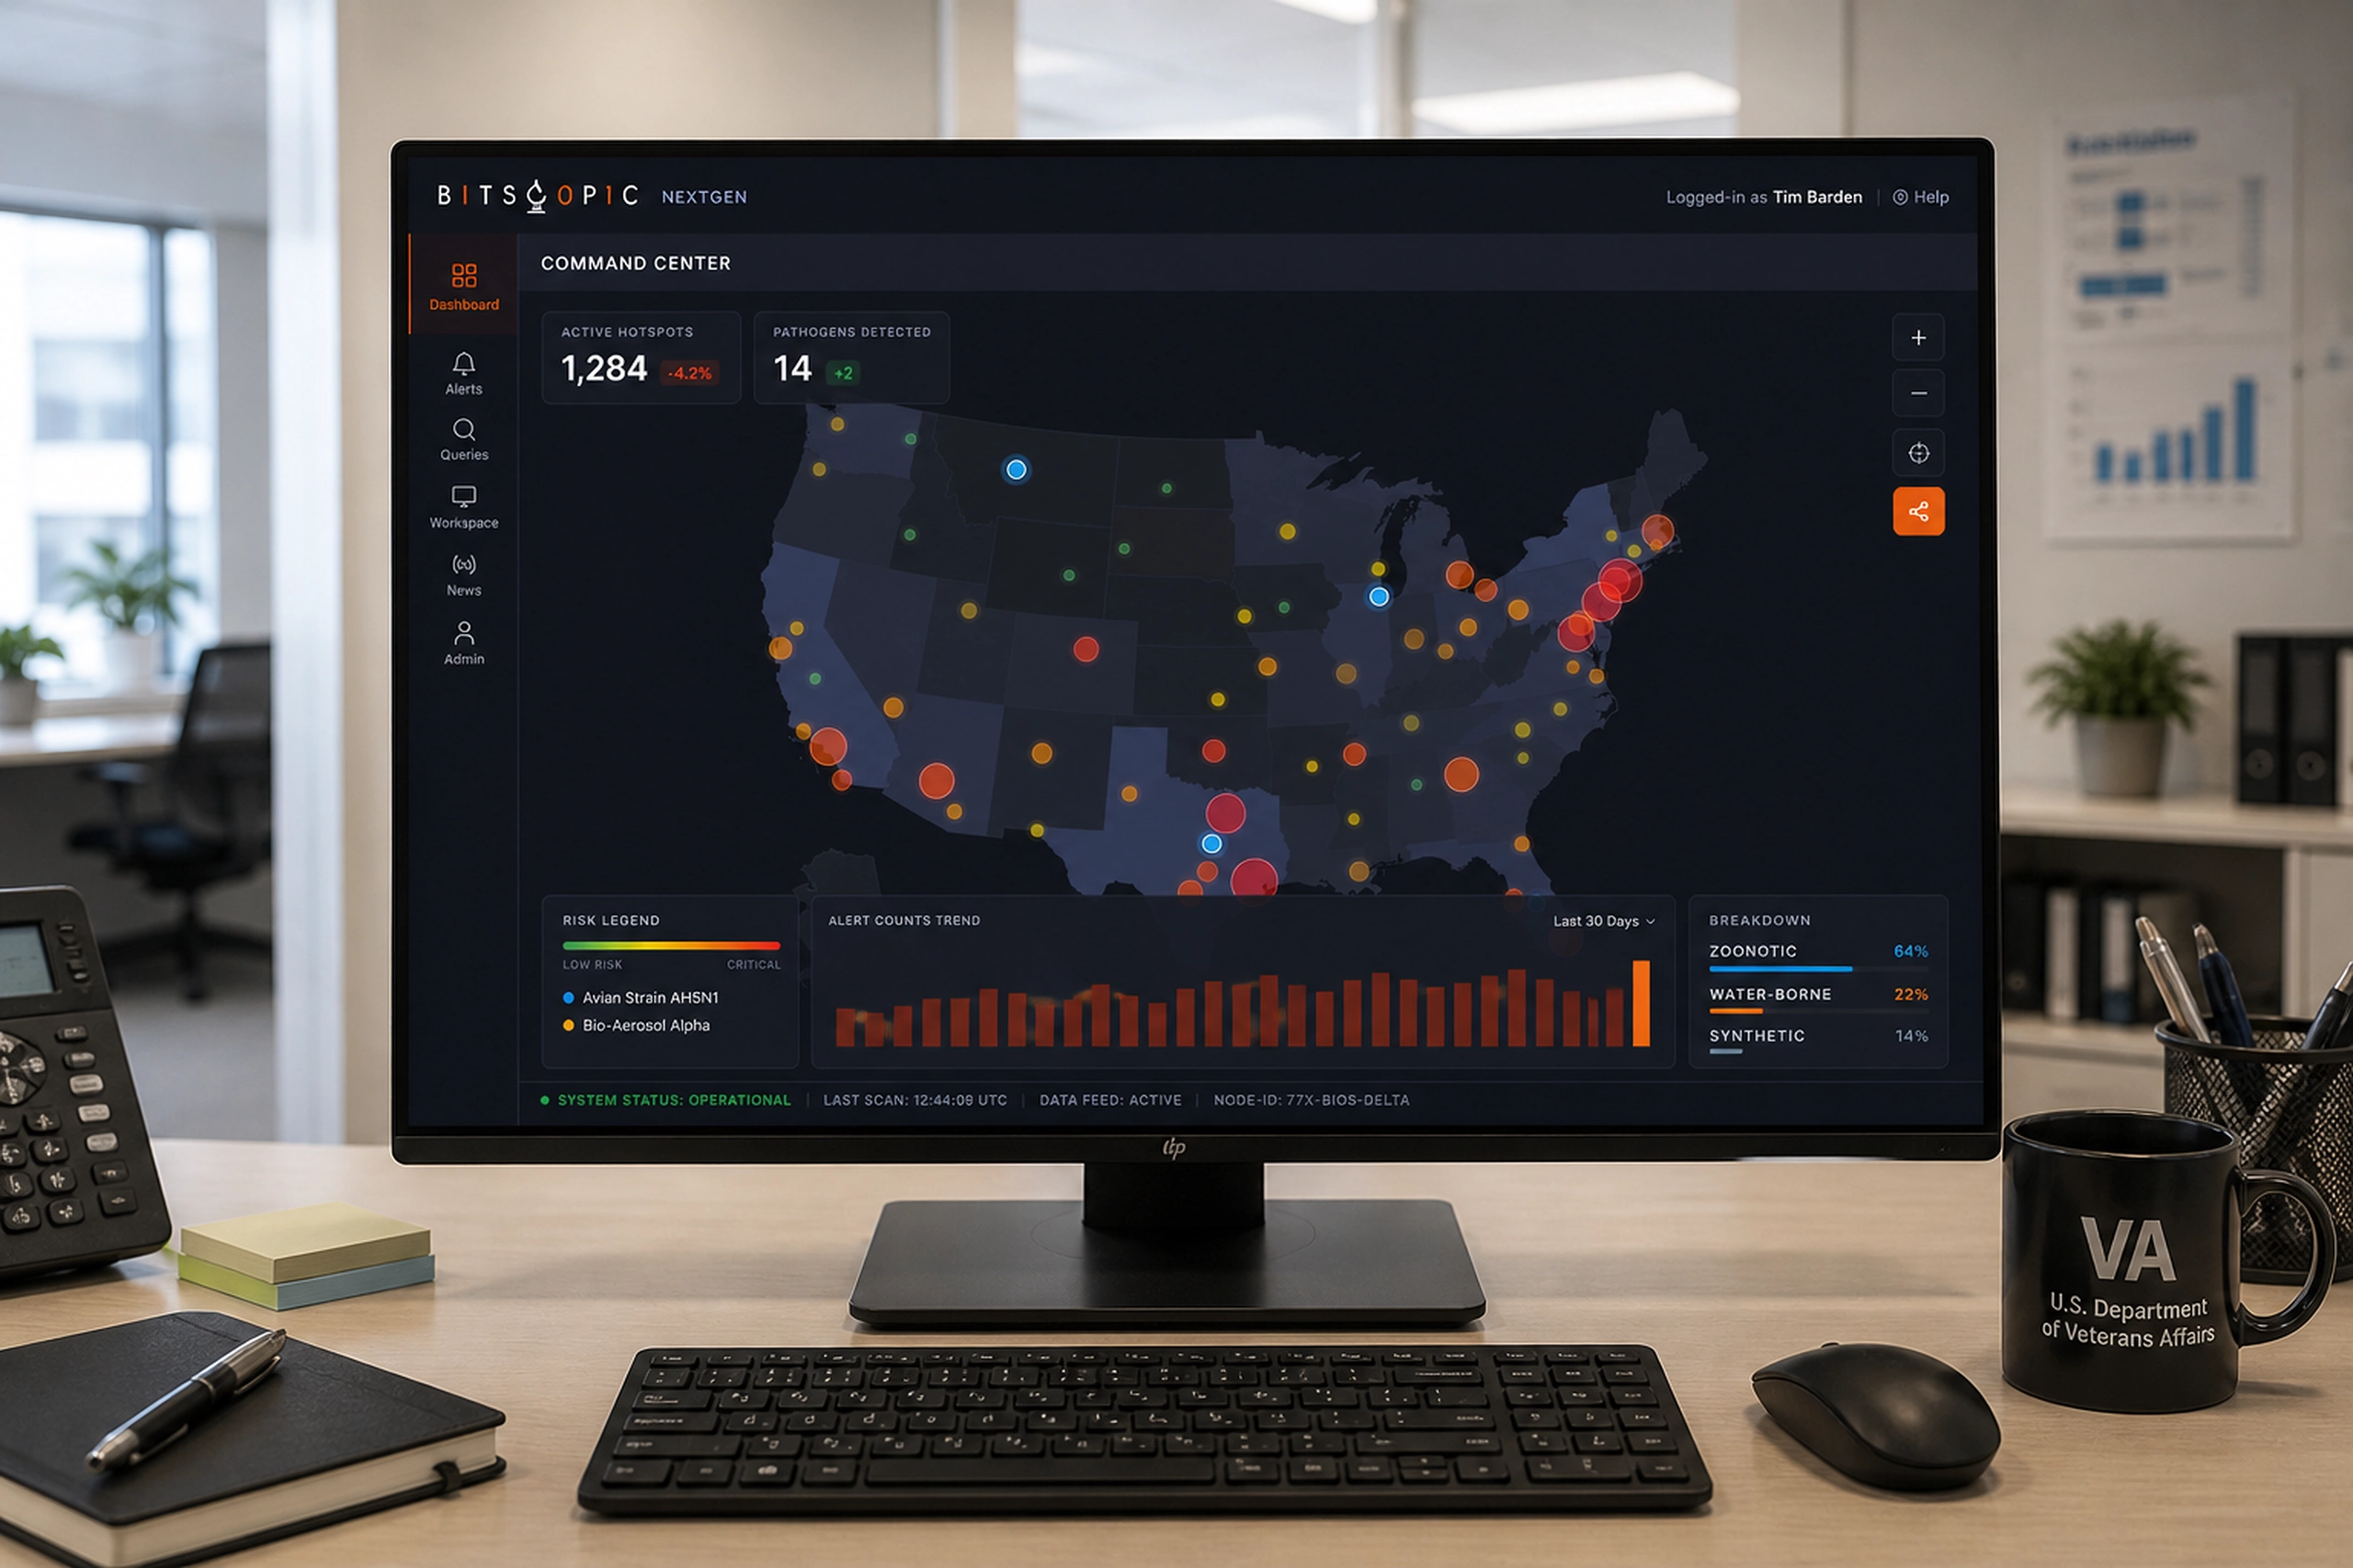
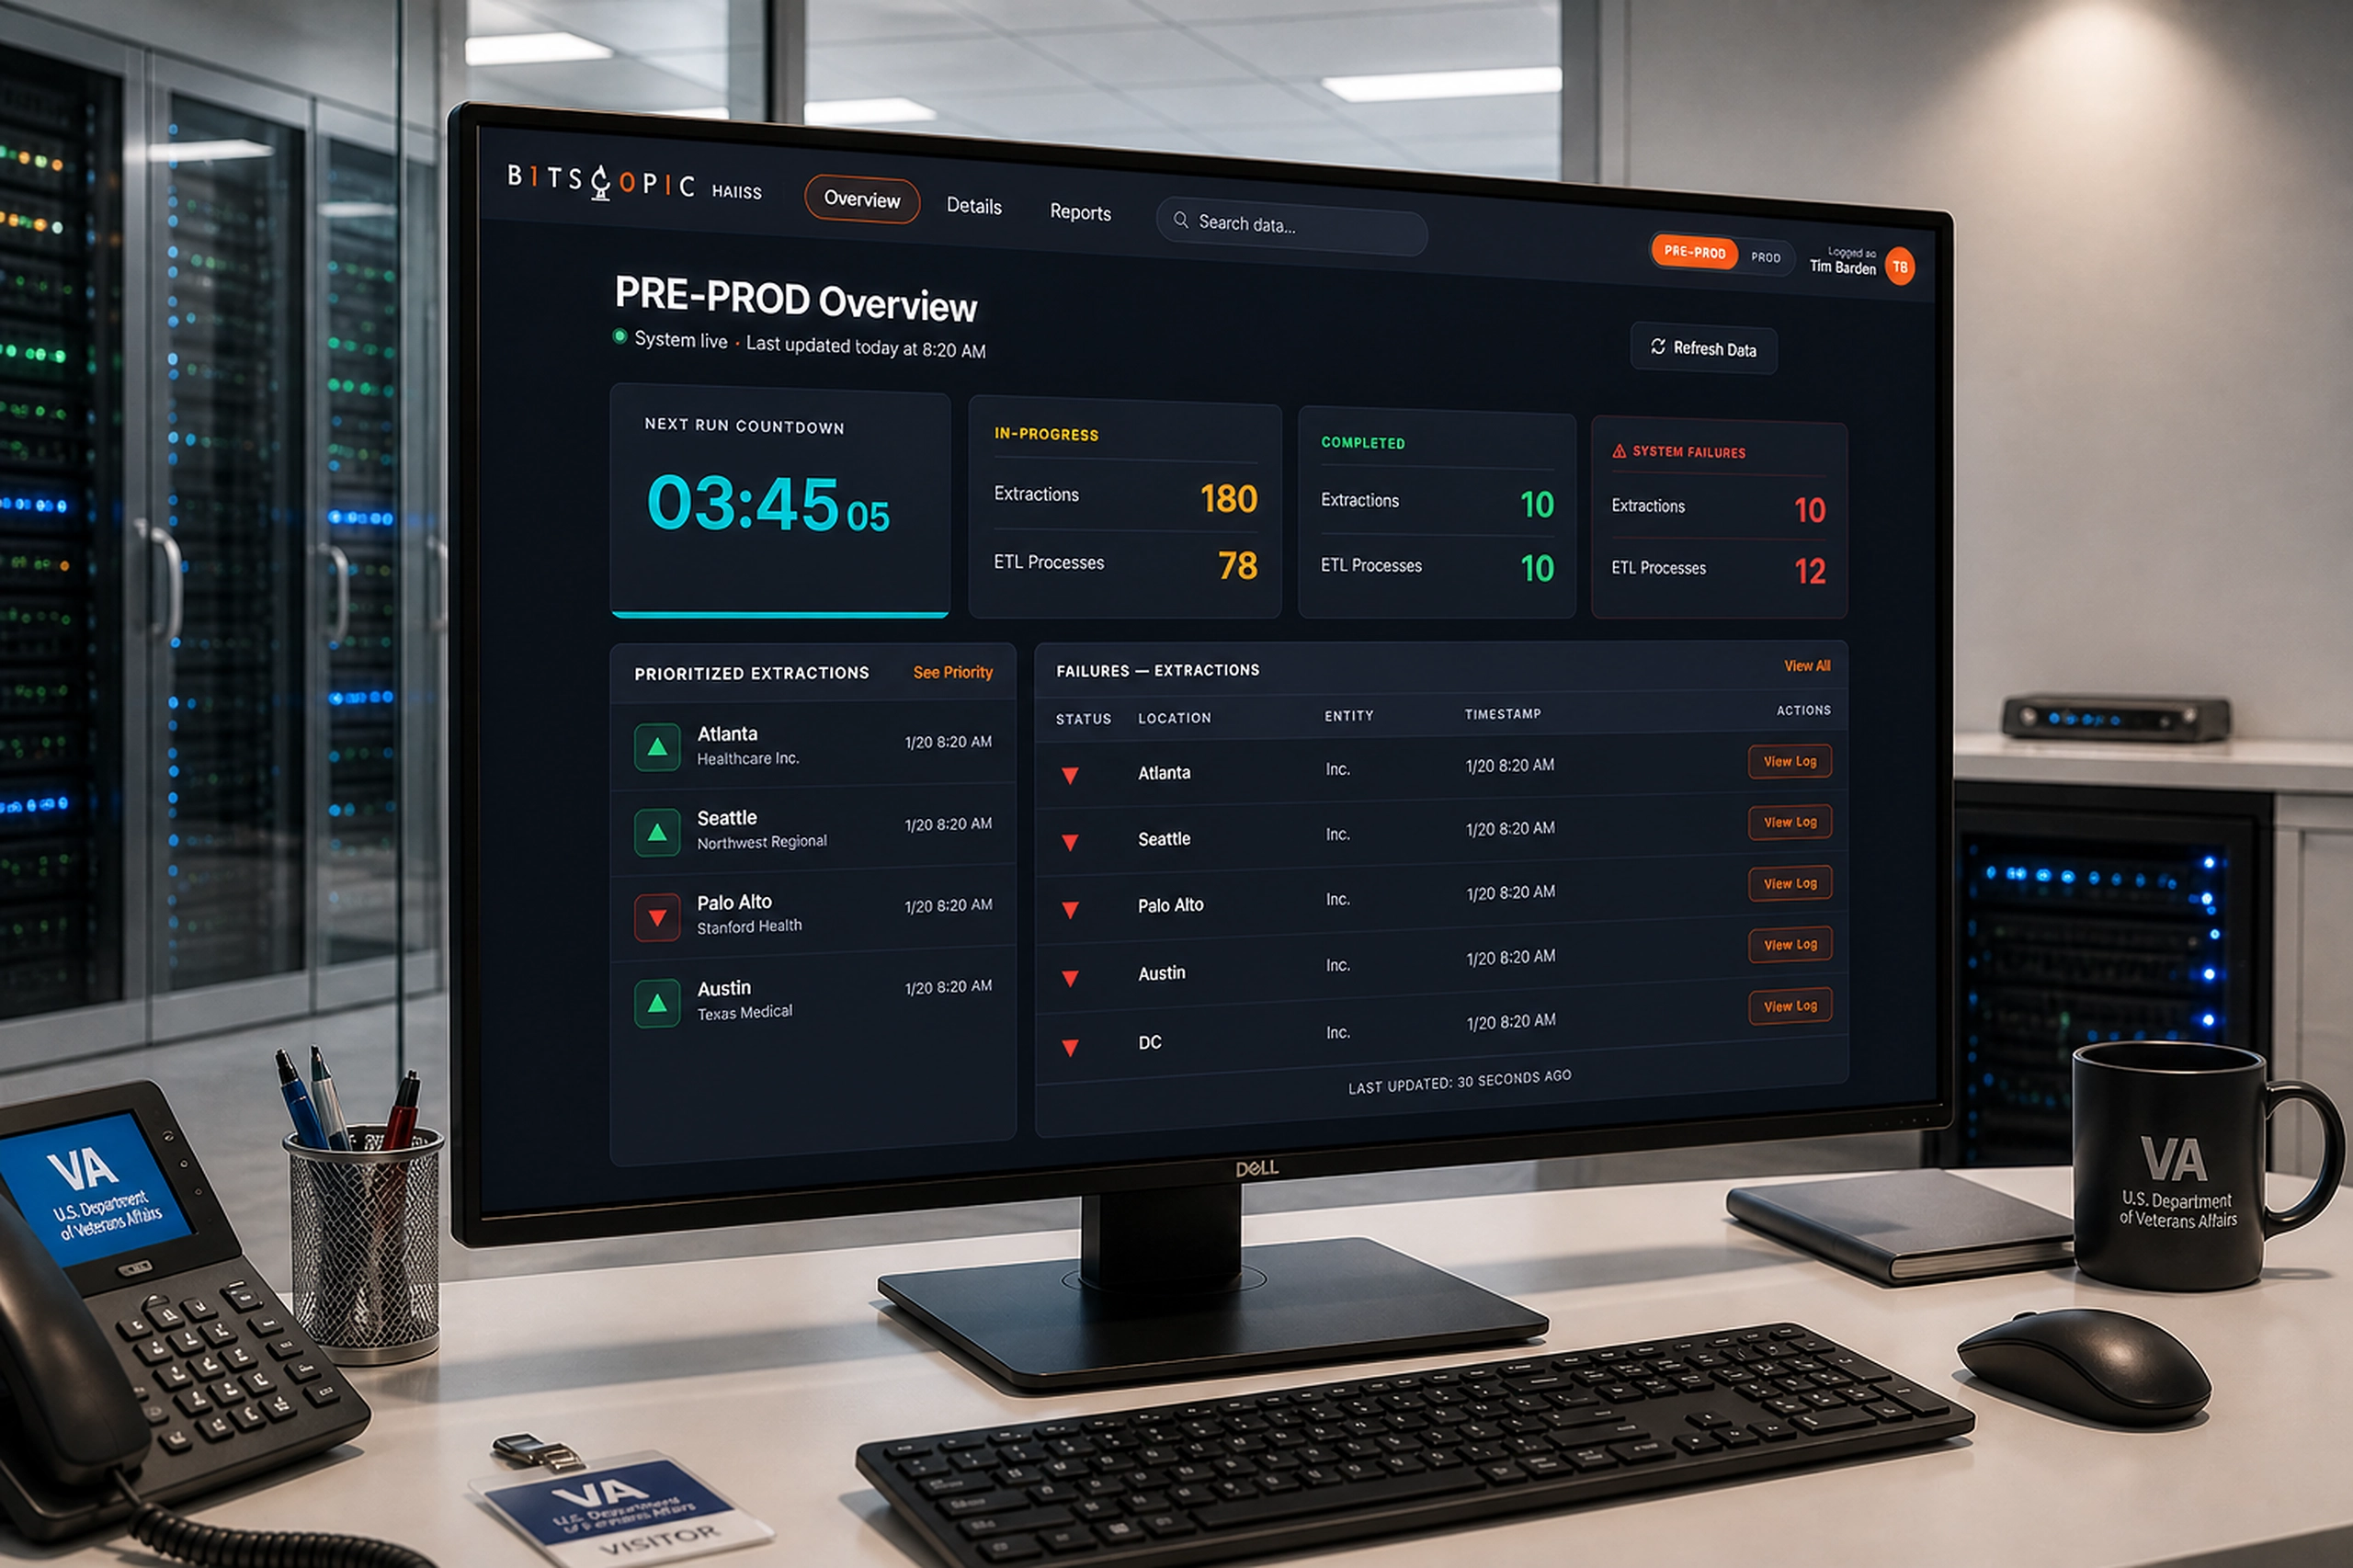
NextGen Biosurveillance
Summary
Monitoring nationwide health signals to detect, filter, and investigate emerging disease patterns.
Public health analysts needed to interpret large volumes of disease signals across regions, facilities, demographics, syndromes, and data sources without losing sight of emerging risk.
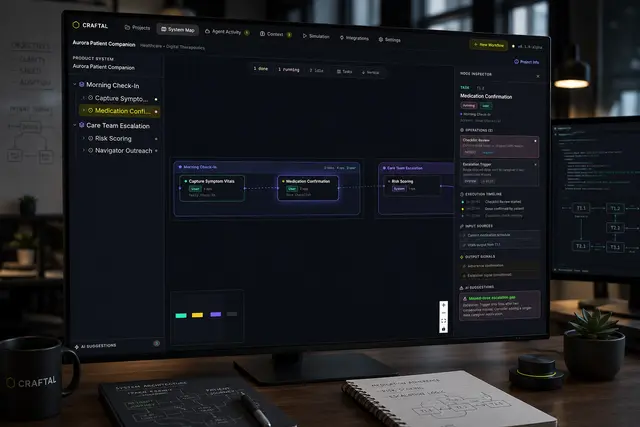
I designed NEXT-GEN as a surveillance command center, connecting map-based awareness, alert triage, advanced filters, detailed records, and source reliability into one workflow.
Outcome
A clearer operating model for surveillance work.
NEXT-GEN gave analysts a more coherent way to understand national disease activity. It connected broad map-based awareness with detailed filtering, breakdowns, and source reliability.
The result was a product that supported both immediate triage and deeper investigation.
Practical improvements included:
- Faster recognition of geographic hotspots.
- Clearer comparison across categories and facilities.
- More precise filtering for syndromes and alert levels.
- Better confidence in source reliability and ingestion health.
- A stronger bridge between monitoring, analysis, and action.
This project reinforced a core lesson from healthcare systems work: clarity does not mean simplifying the domain until it becomes shallow. It means organizing complexity so experts can move faster.
The Problem
Too many signals, not enough operational clarity.
Disease surveillance is a pattern-recognition problem under pressure. Analysts need to notice weak signals, compare activity across locations, and decide whether a cluster deserves investigation.
The challenge was that every signal carried a different meaning. A hotspot, an alert spike, a facility pattern, a syndrome filter, or a data source issue could all change the interpretation.
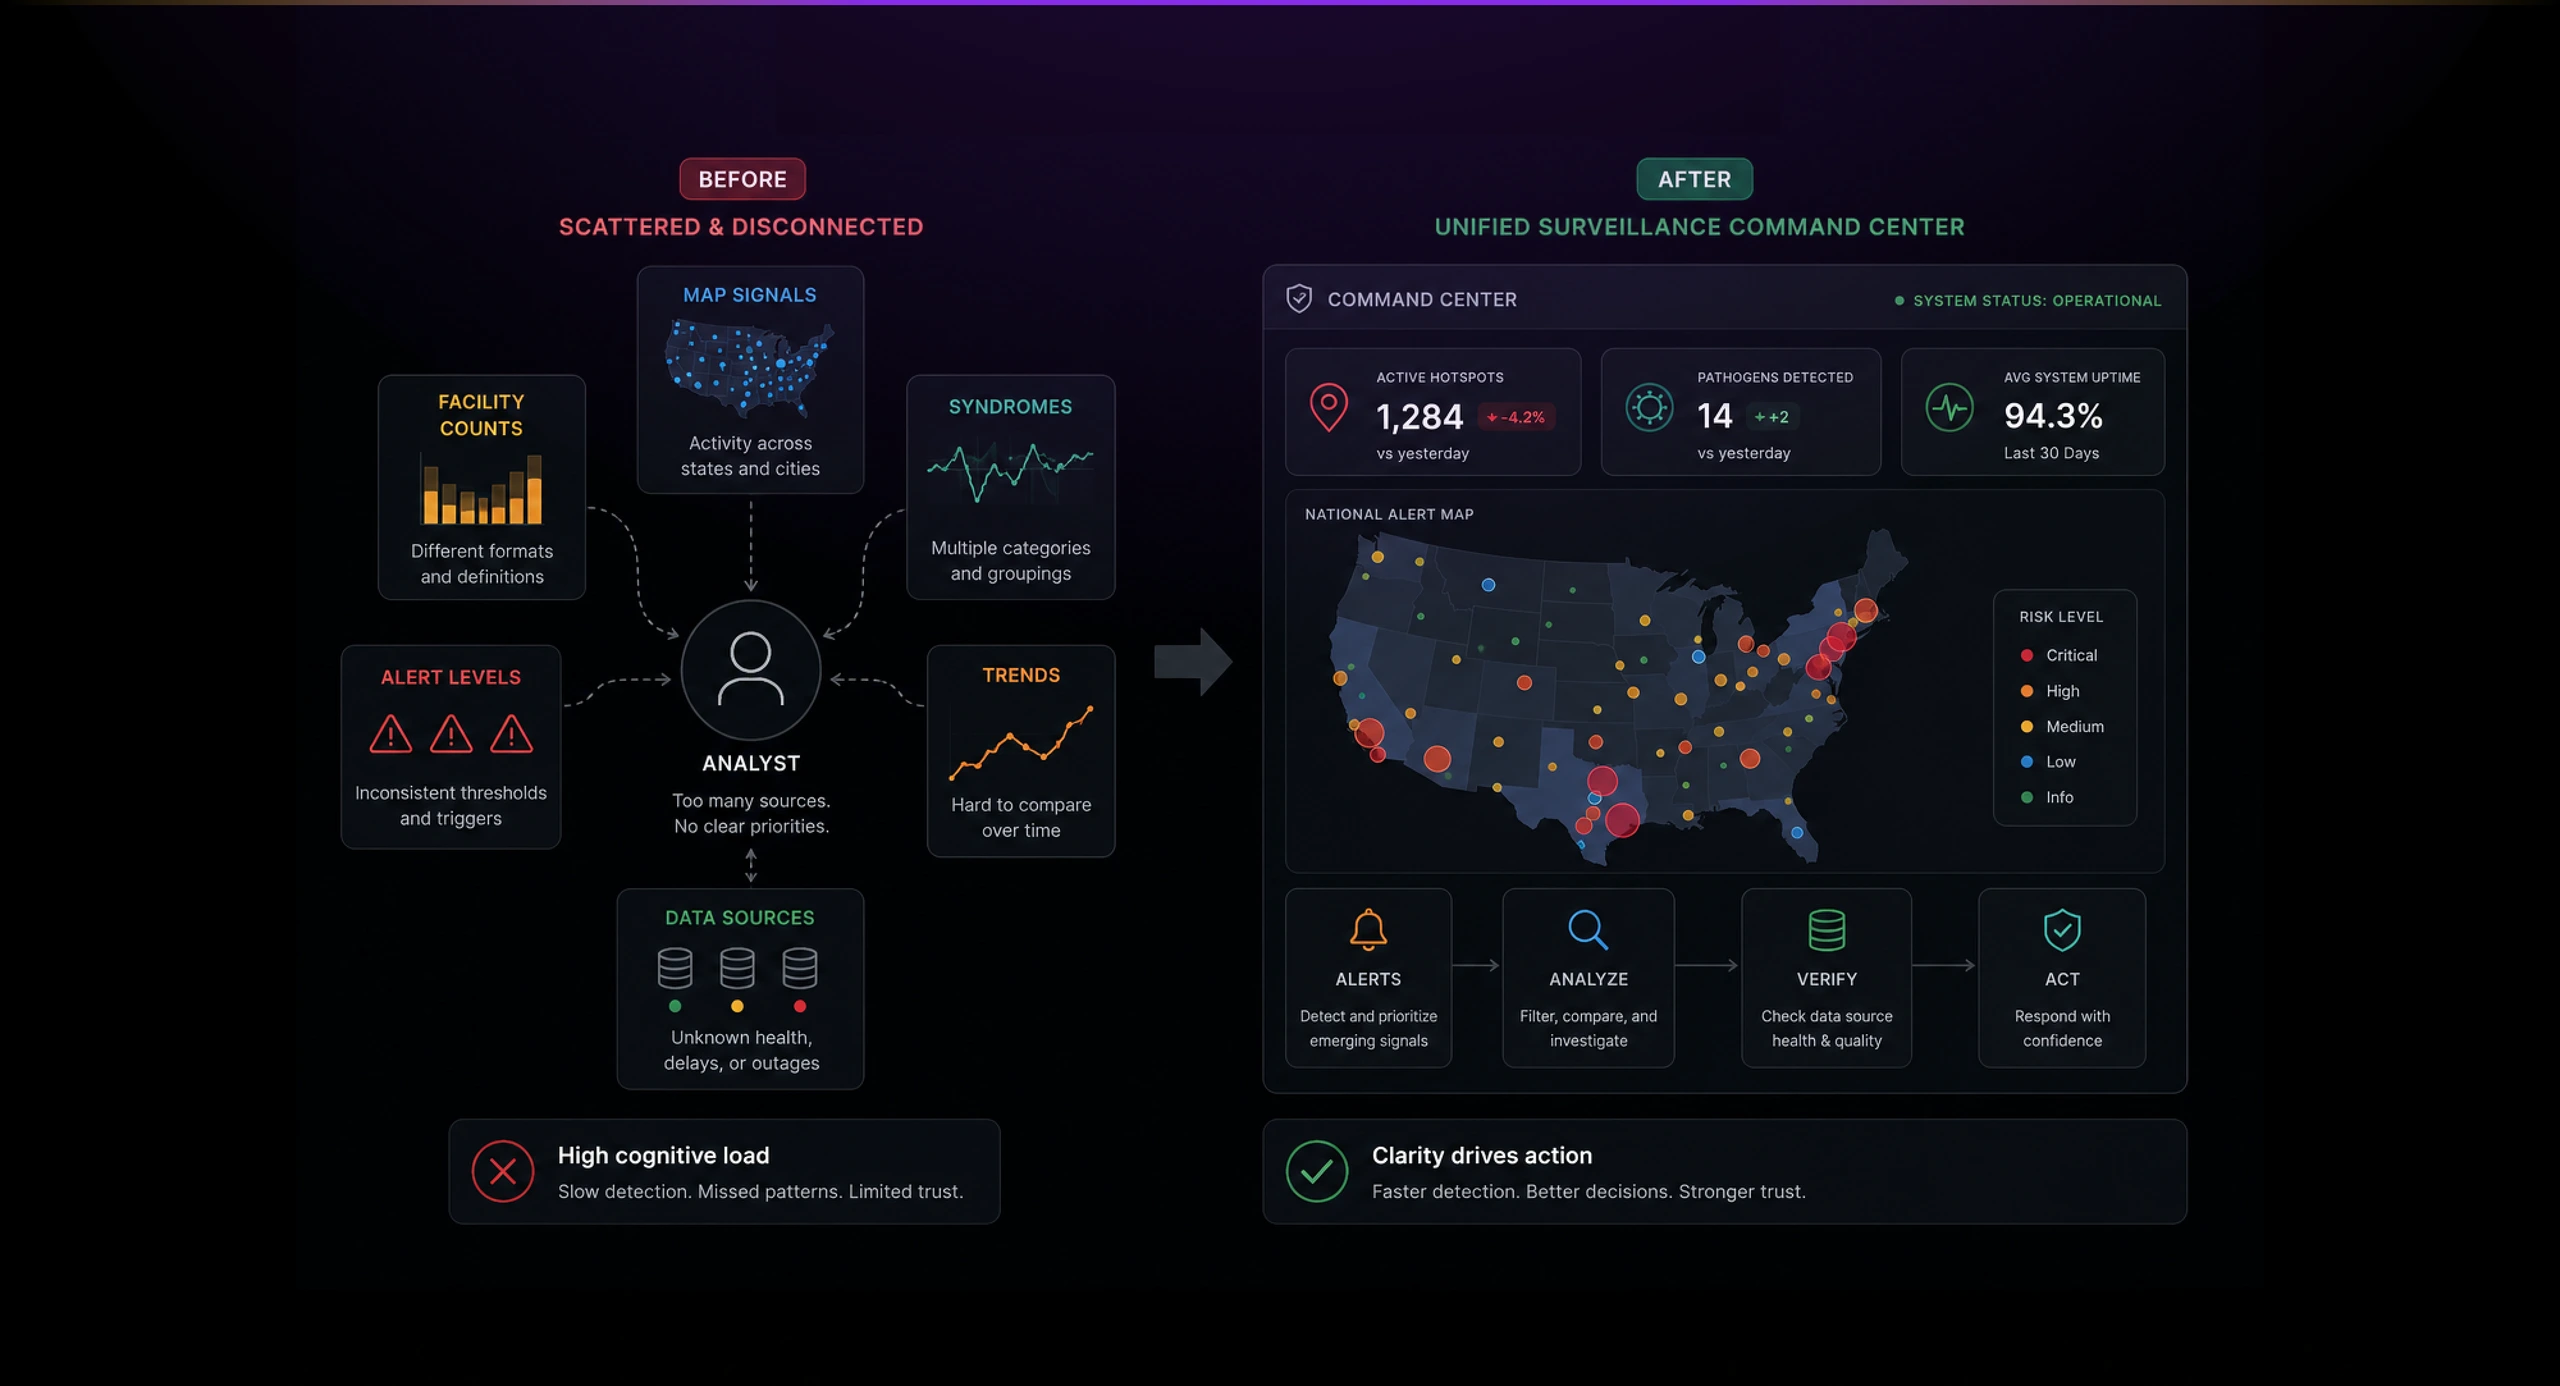
Without a coherent interface, the system could become noisy. Analysts might see activity without knowing what mattered, where to focus, or whether the underlying data was trustworthy.
Solution
Designing a layered workflow from awareness to investigation.
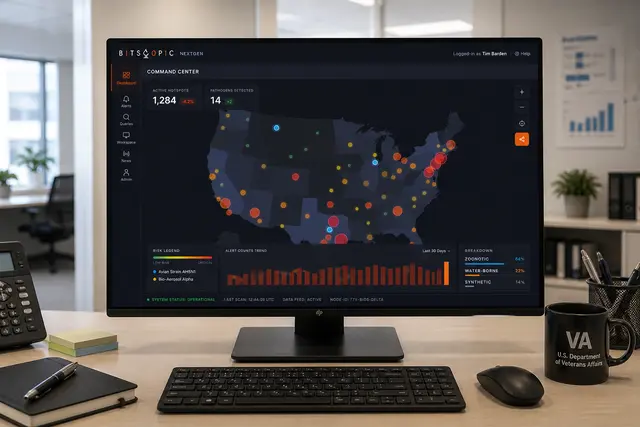
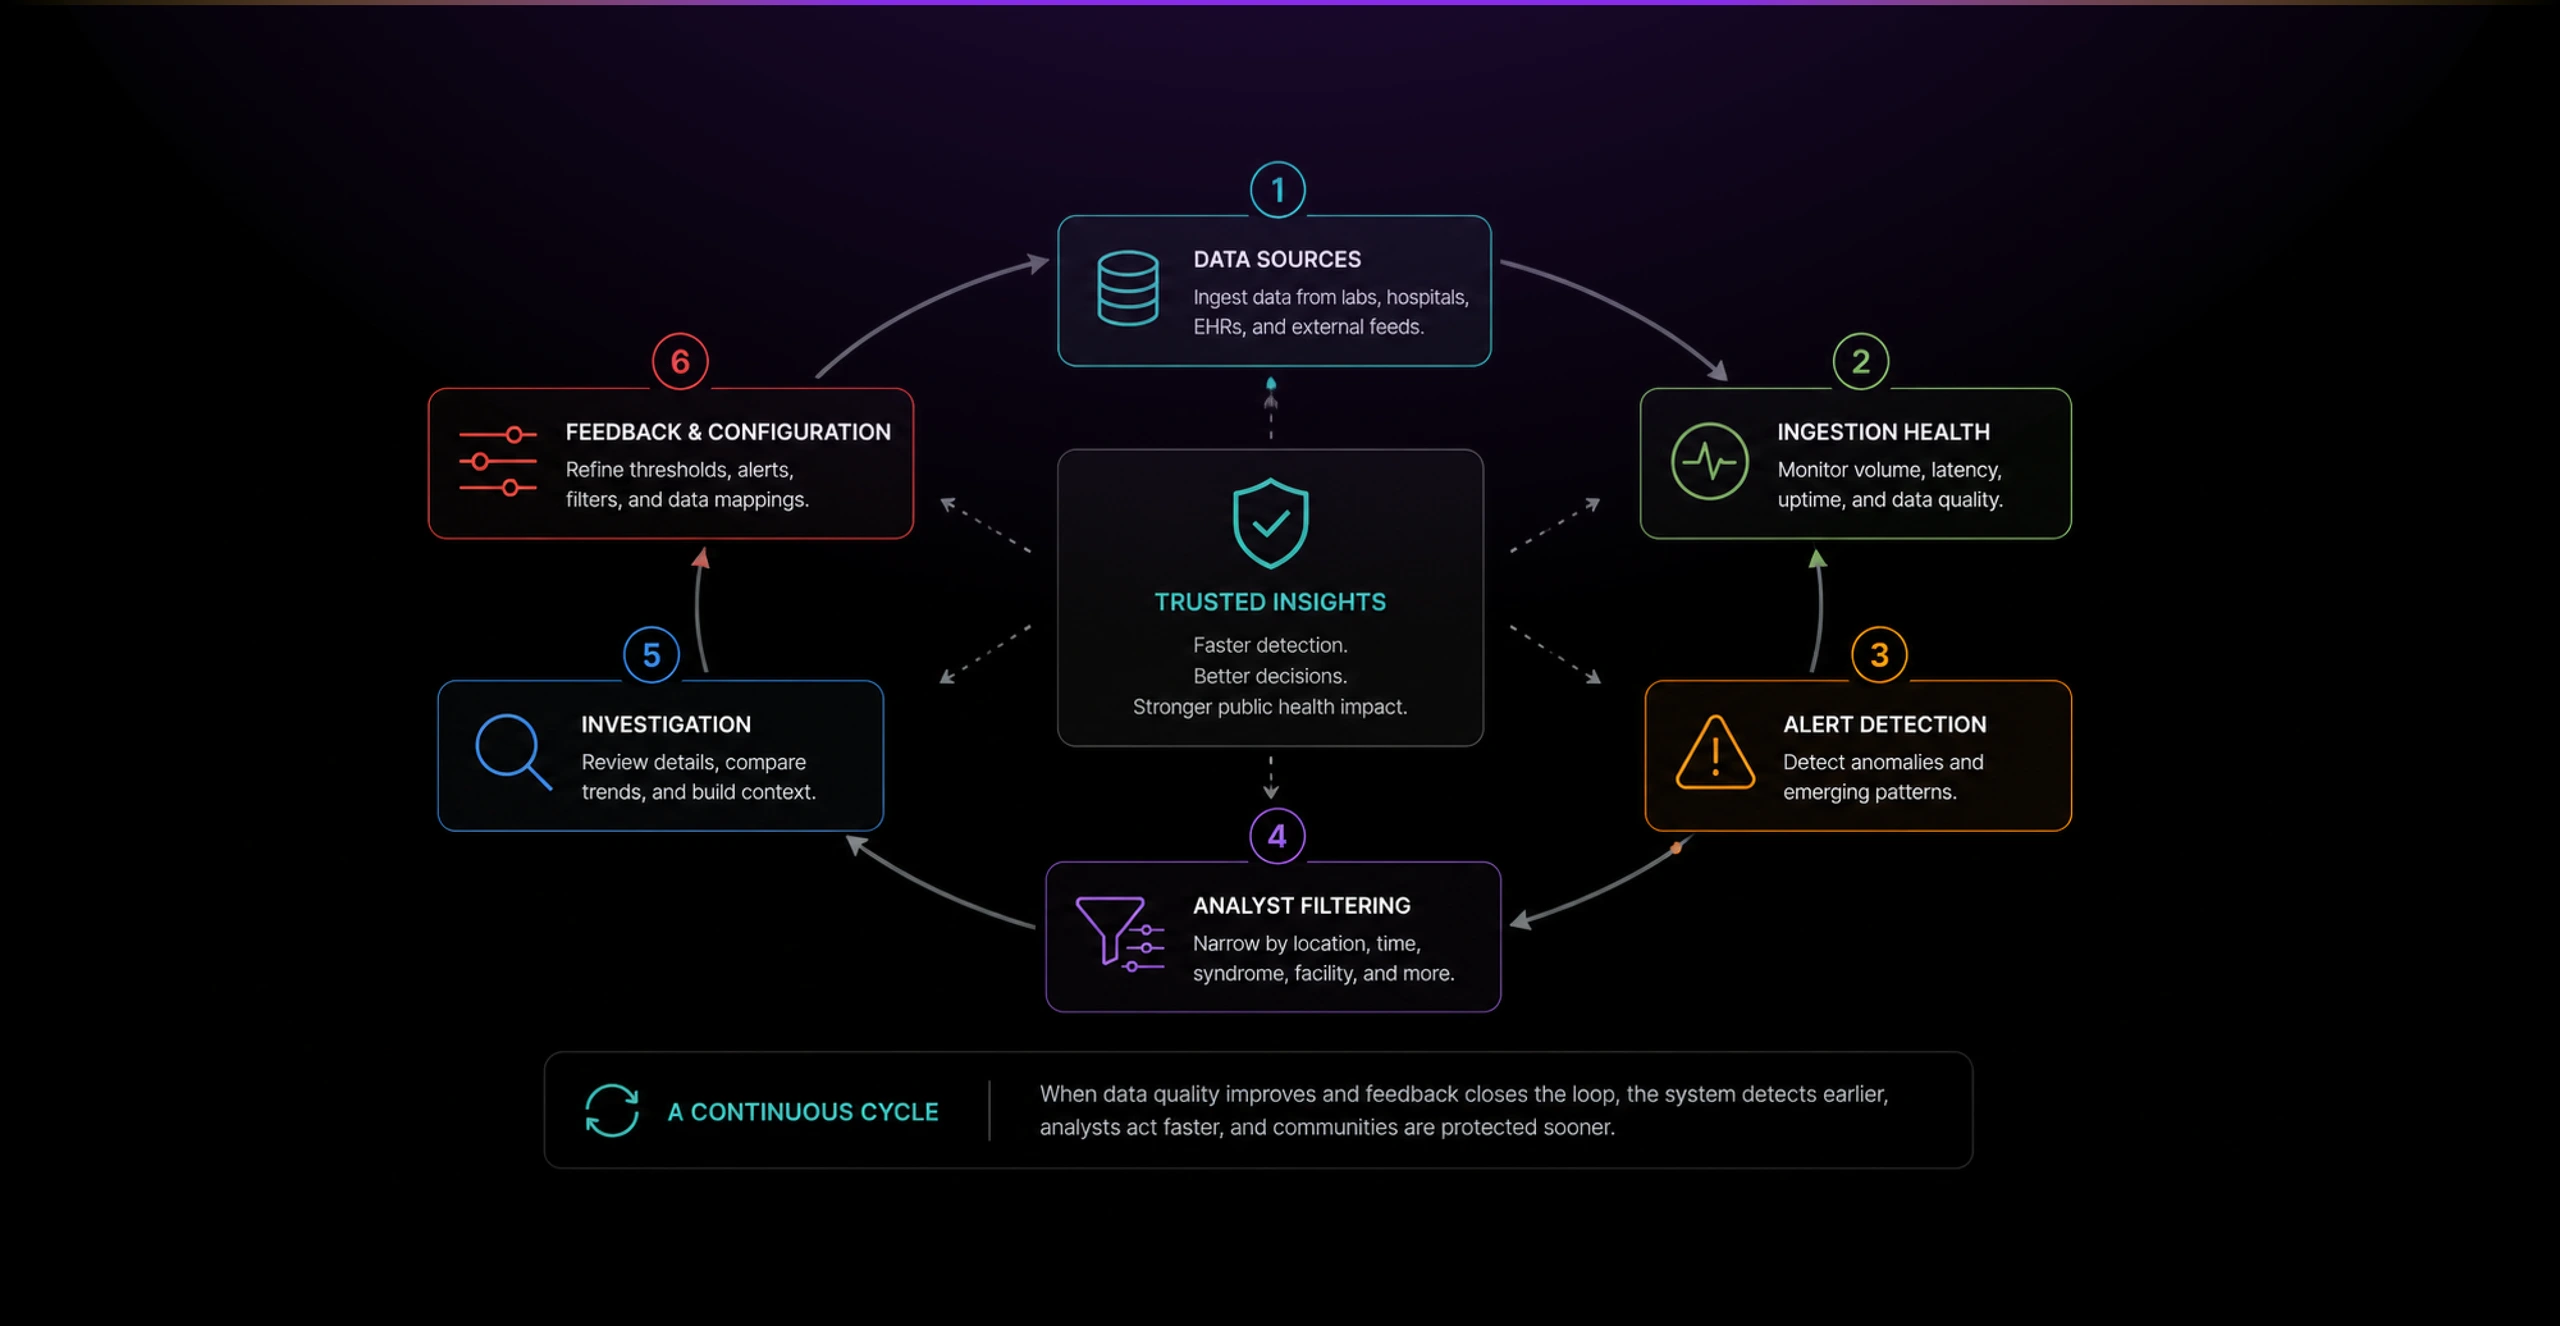
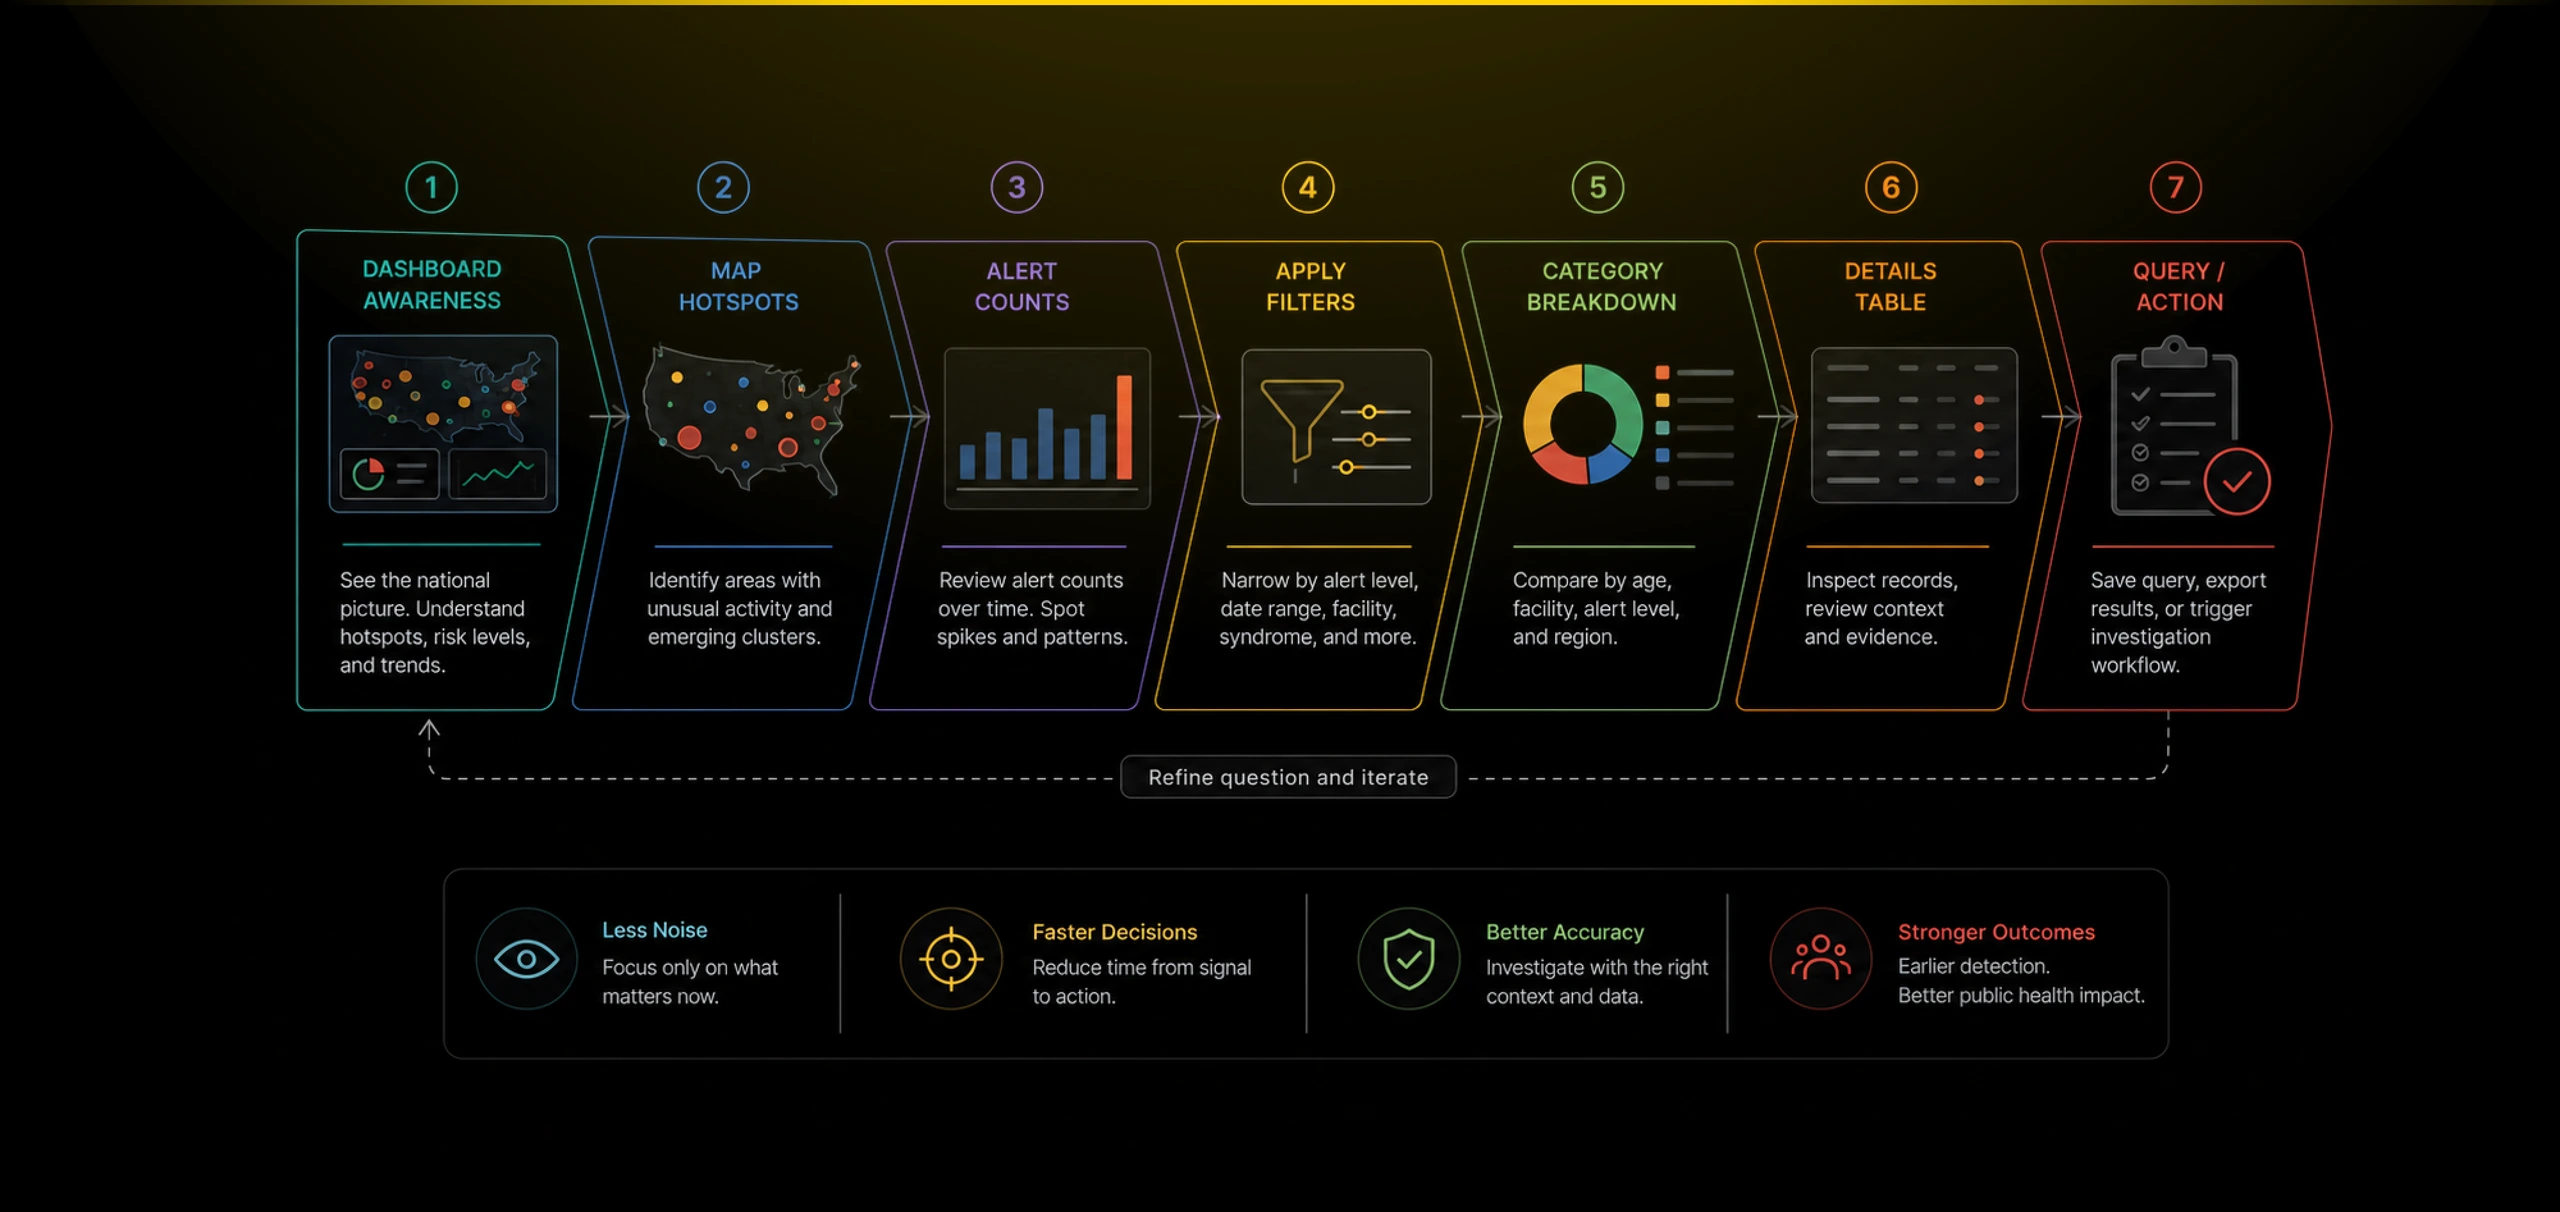
I structured the product around a simple progression: see the national picture, identify what changed, narrow the signal, inspect the details, and verify the data source.
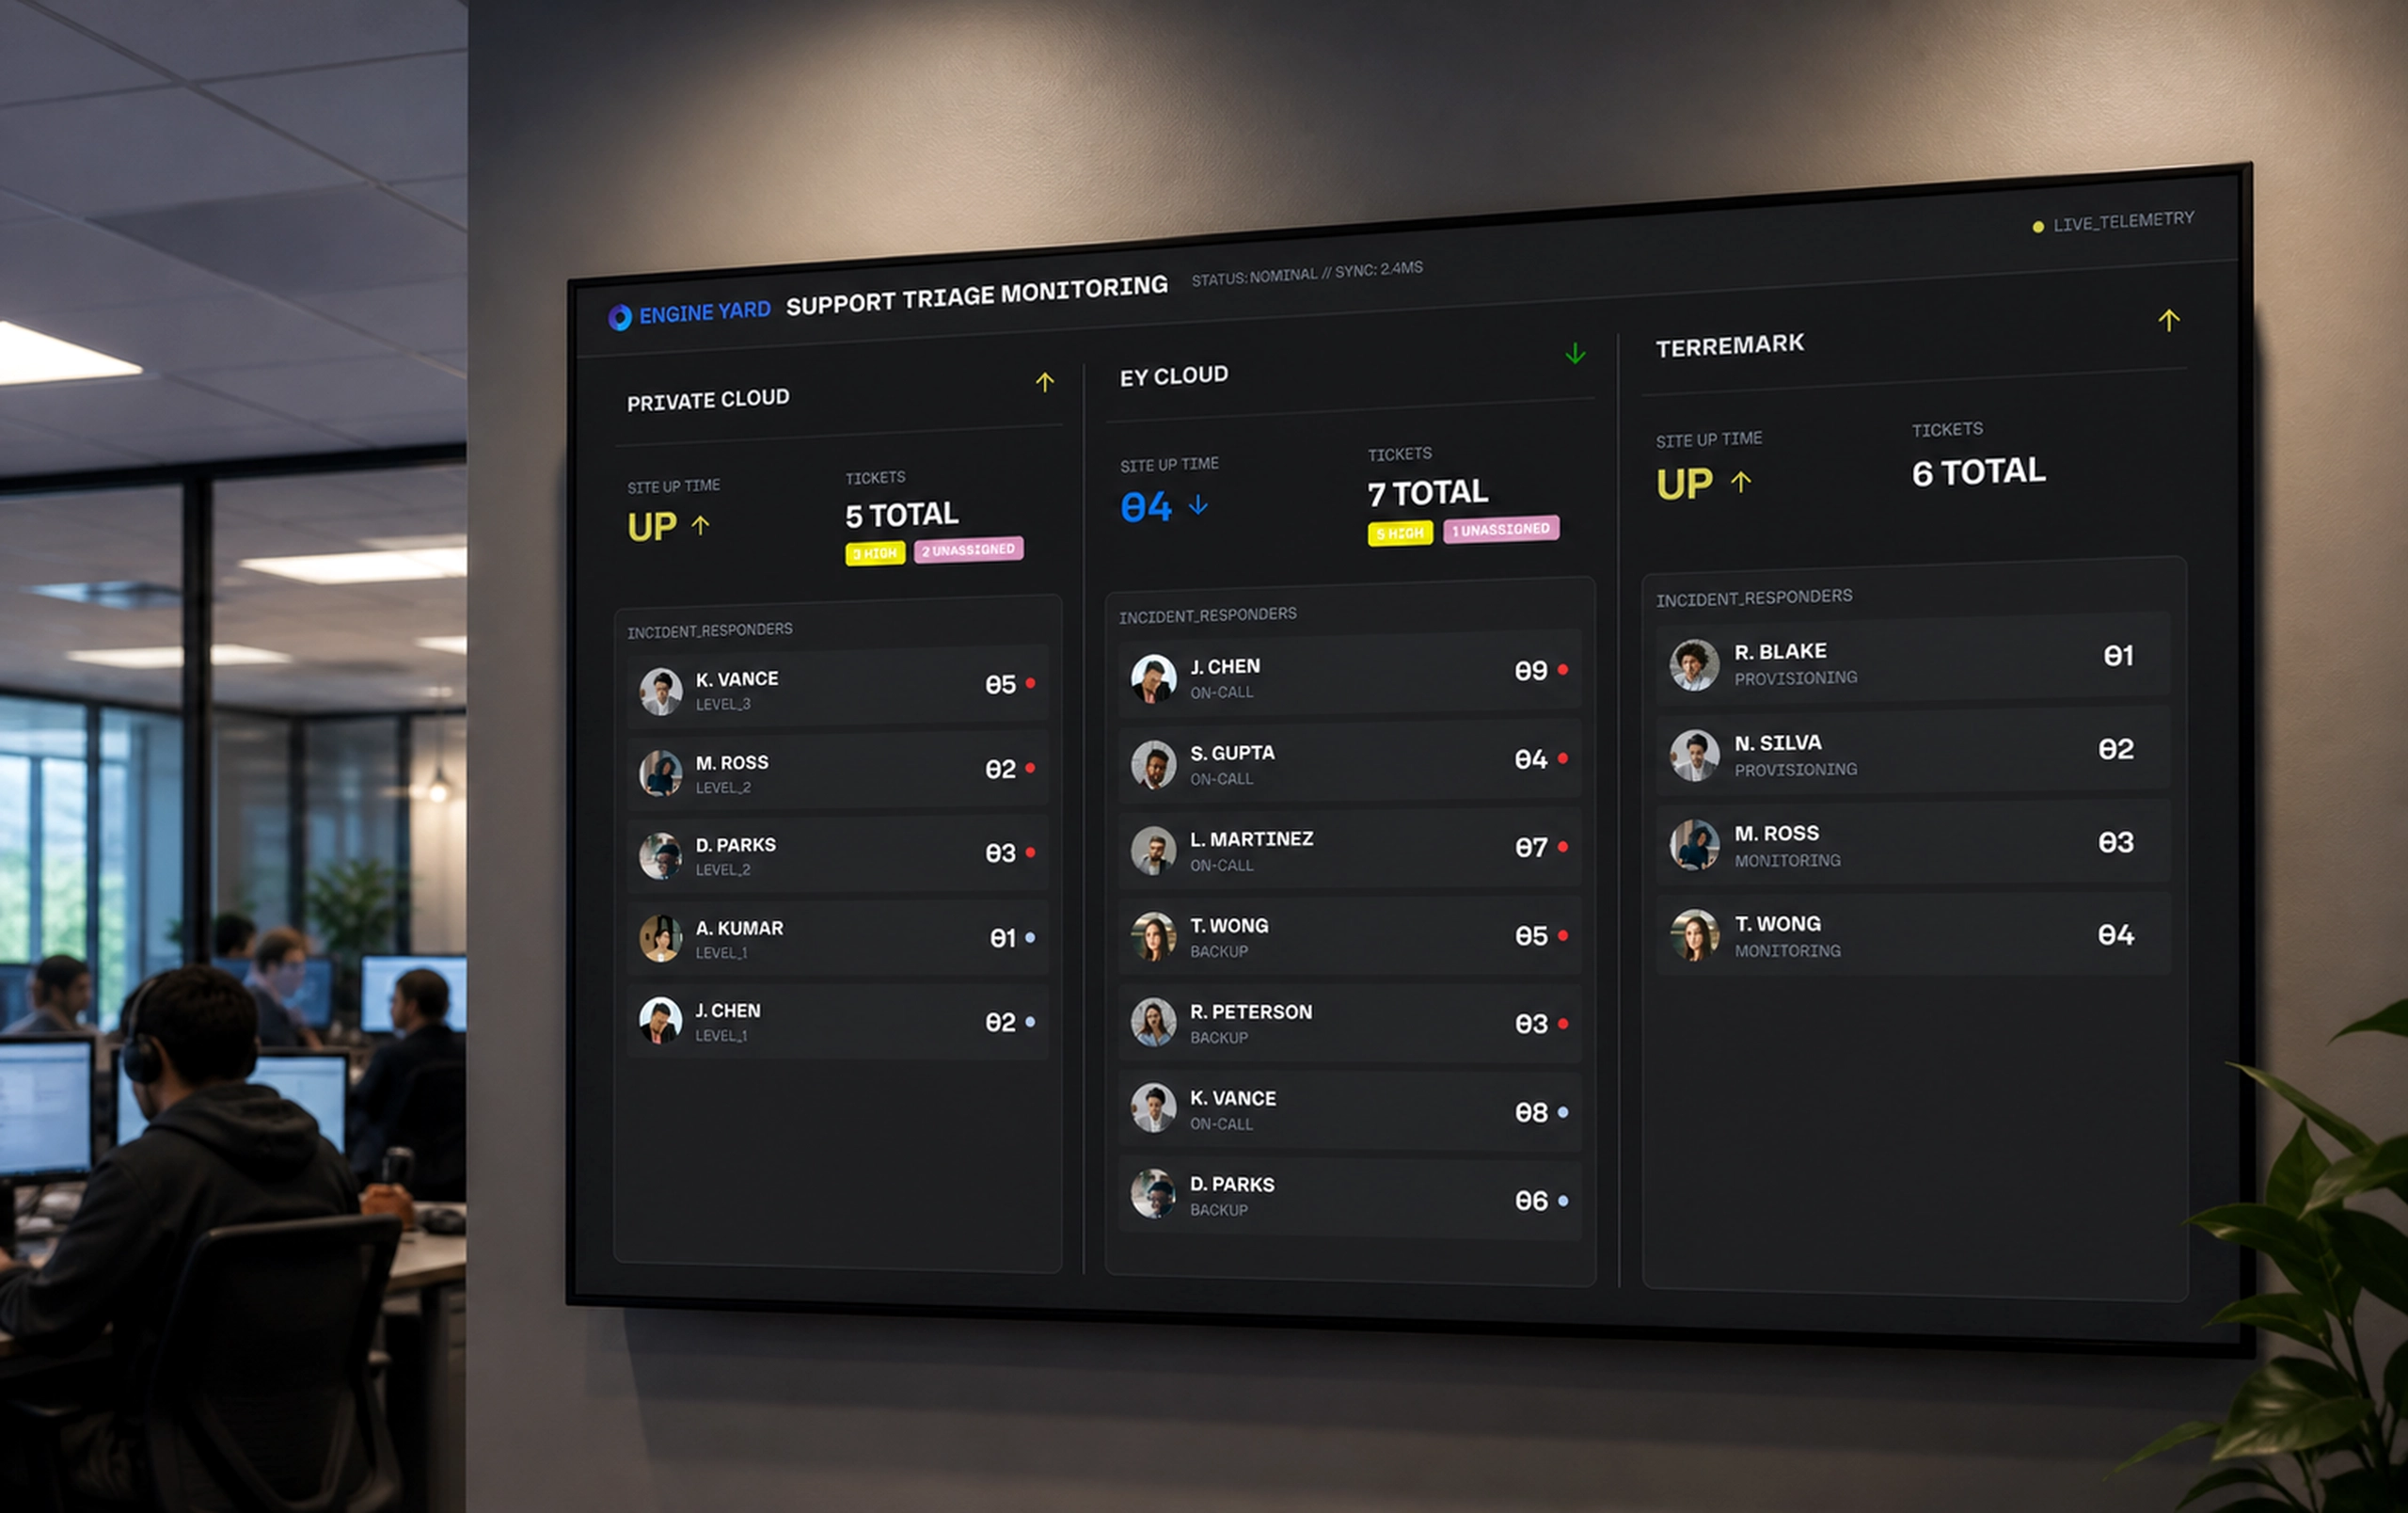
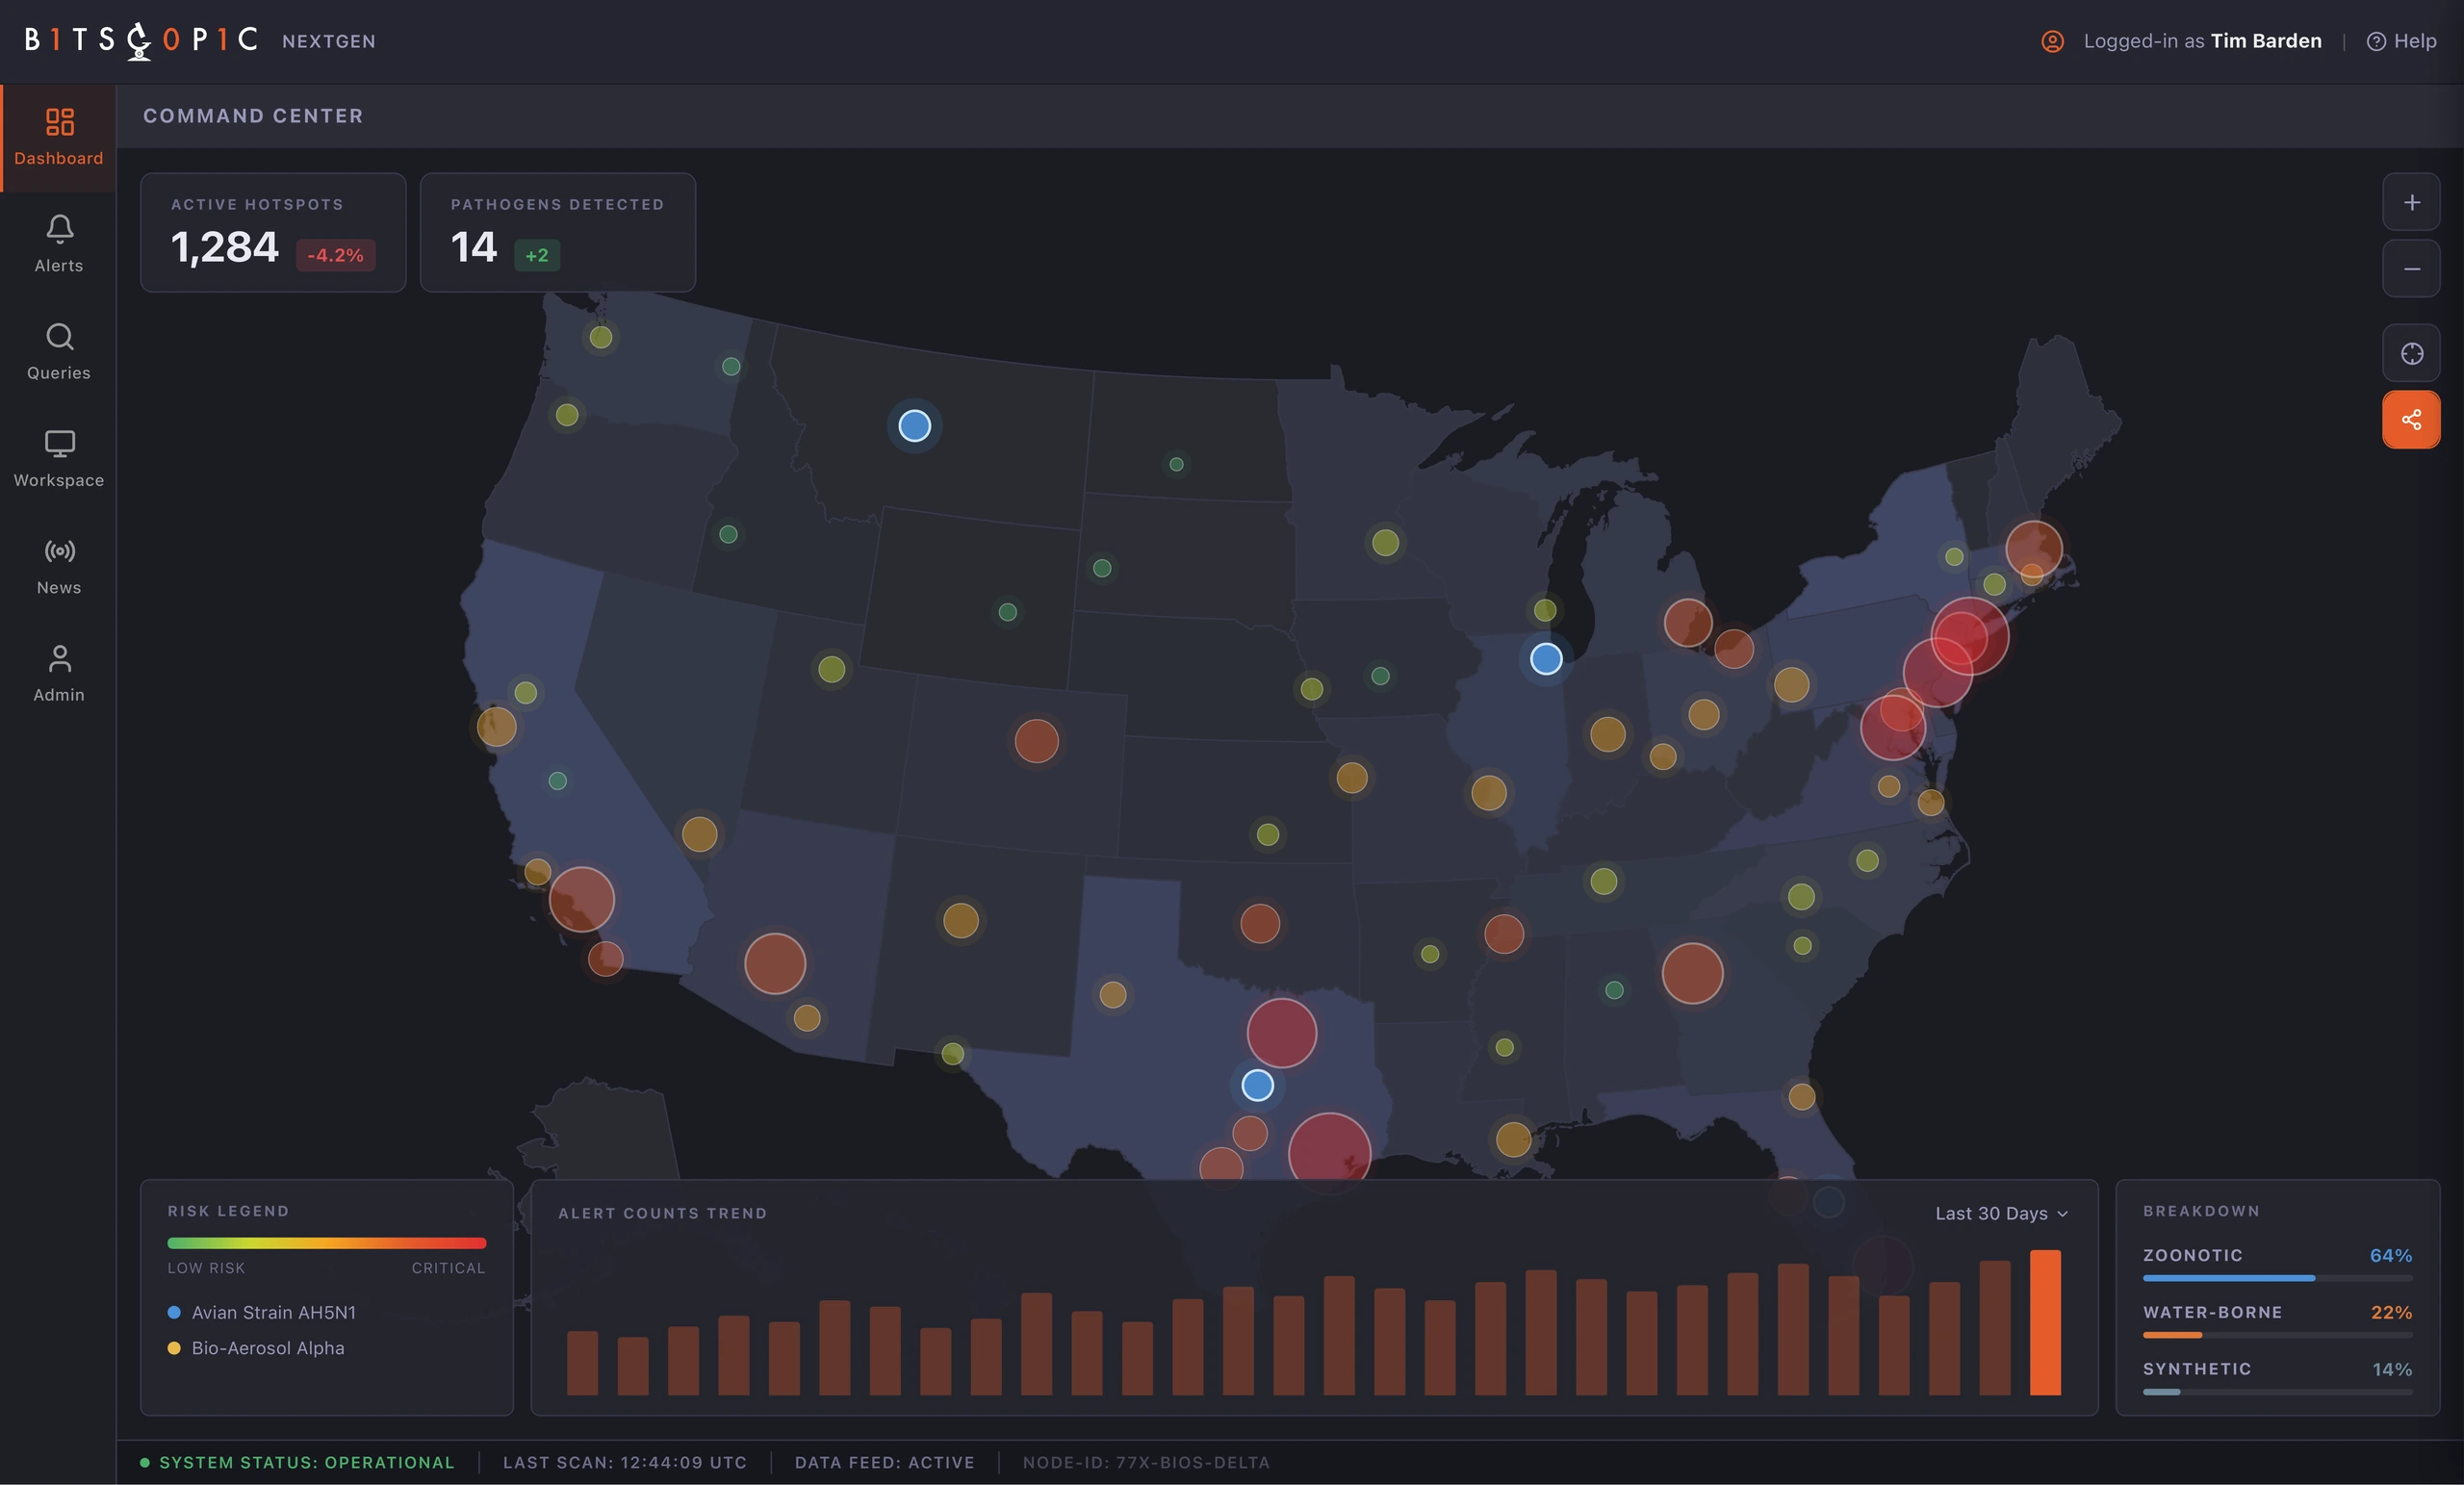
The command center handled broad awareness. It combined national hotspots, active counts, pathogen signals, risk categories, and trend movement into one operating view.
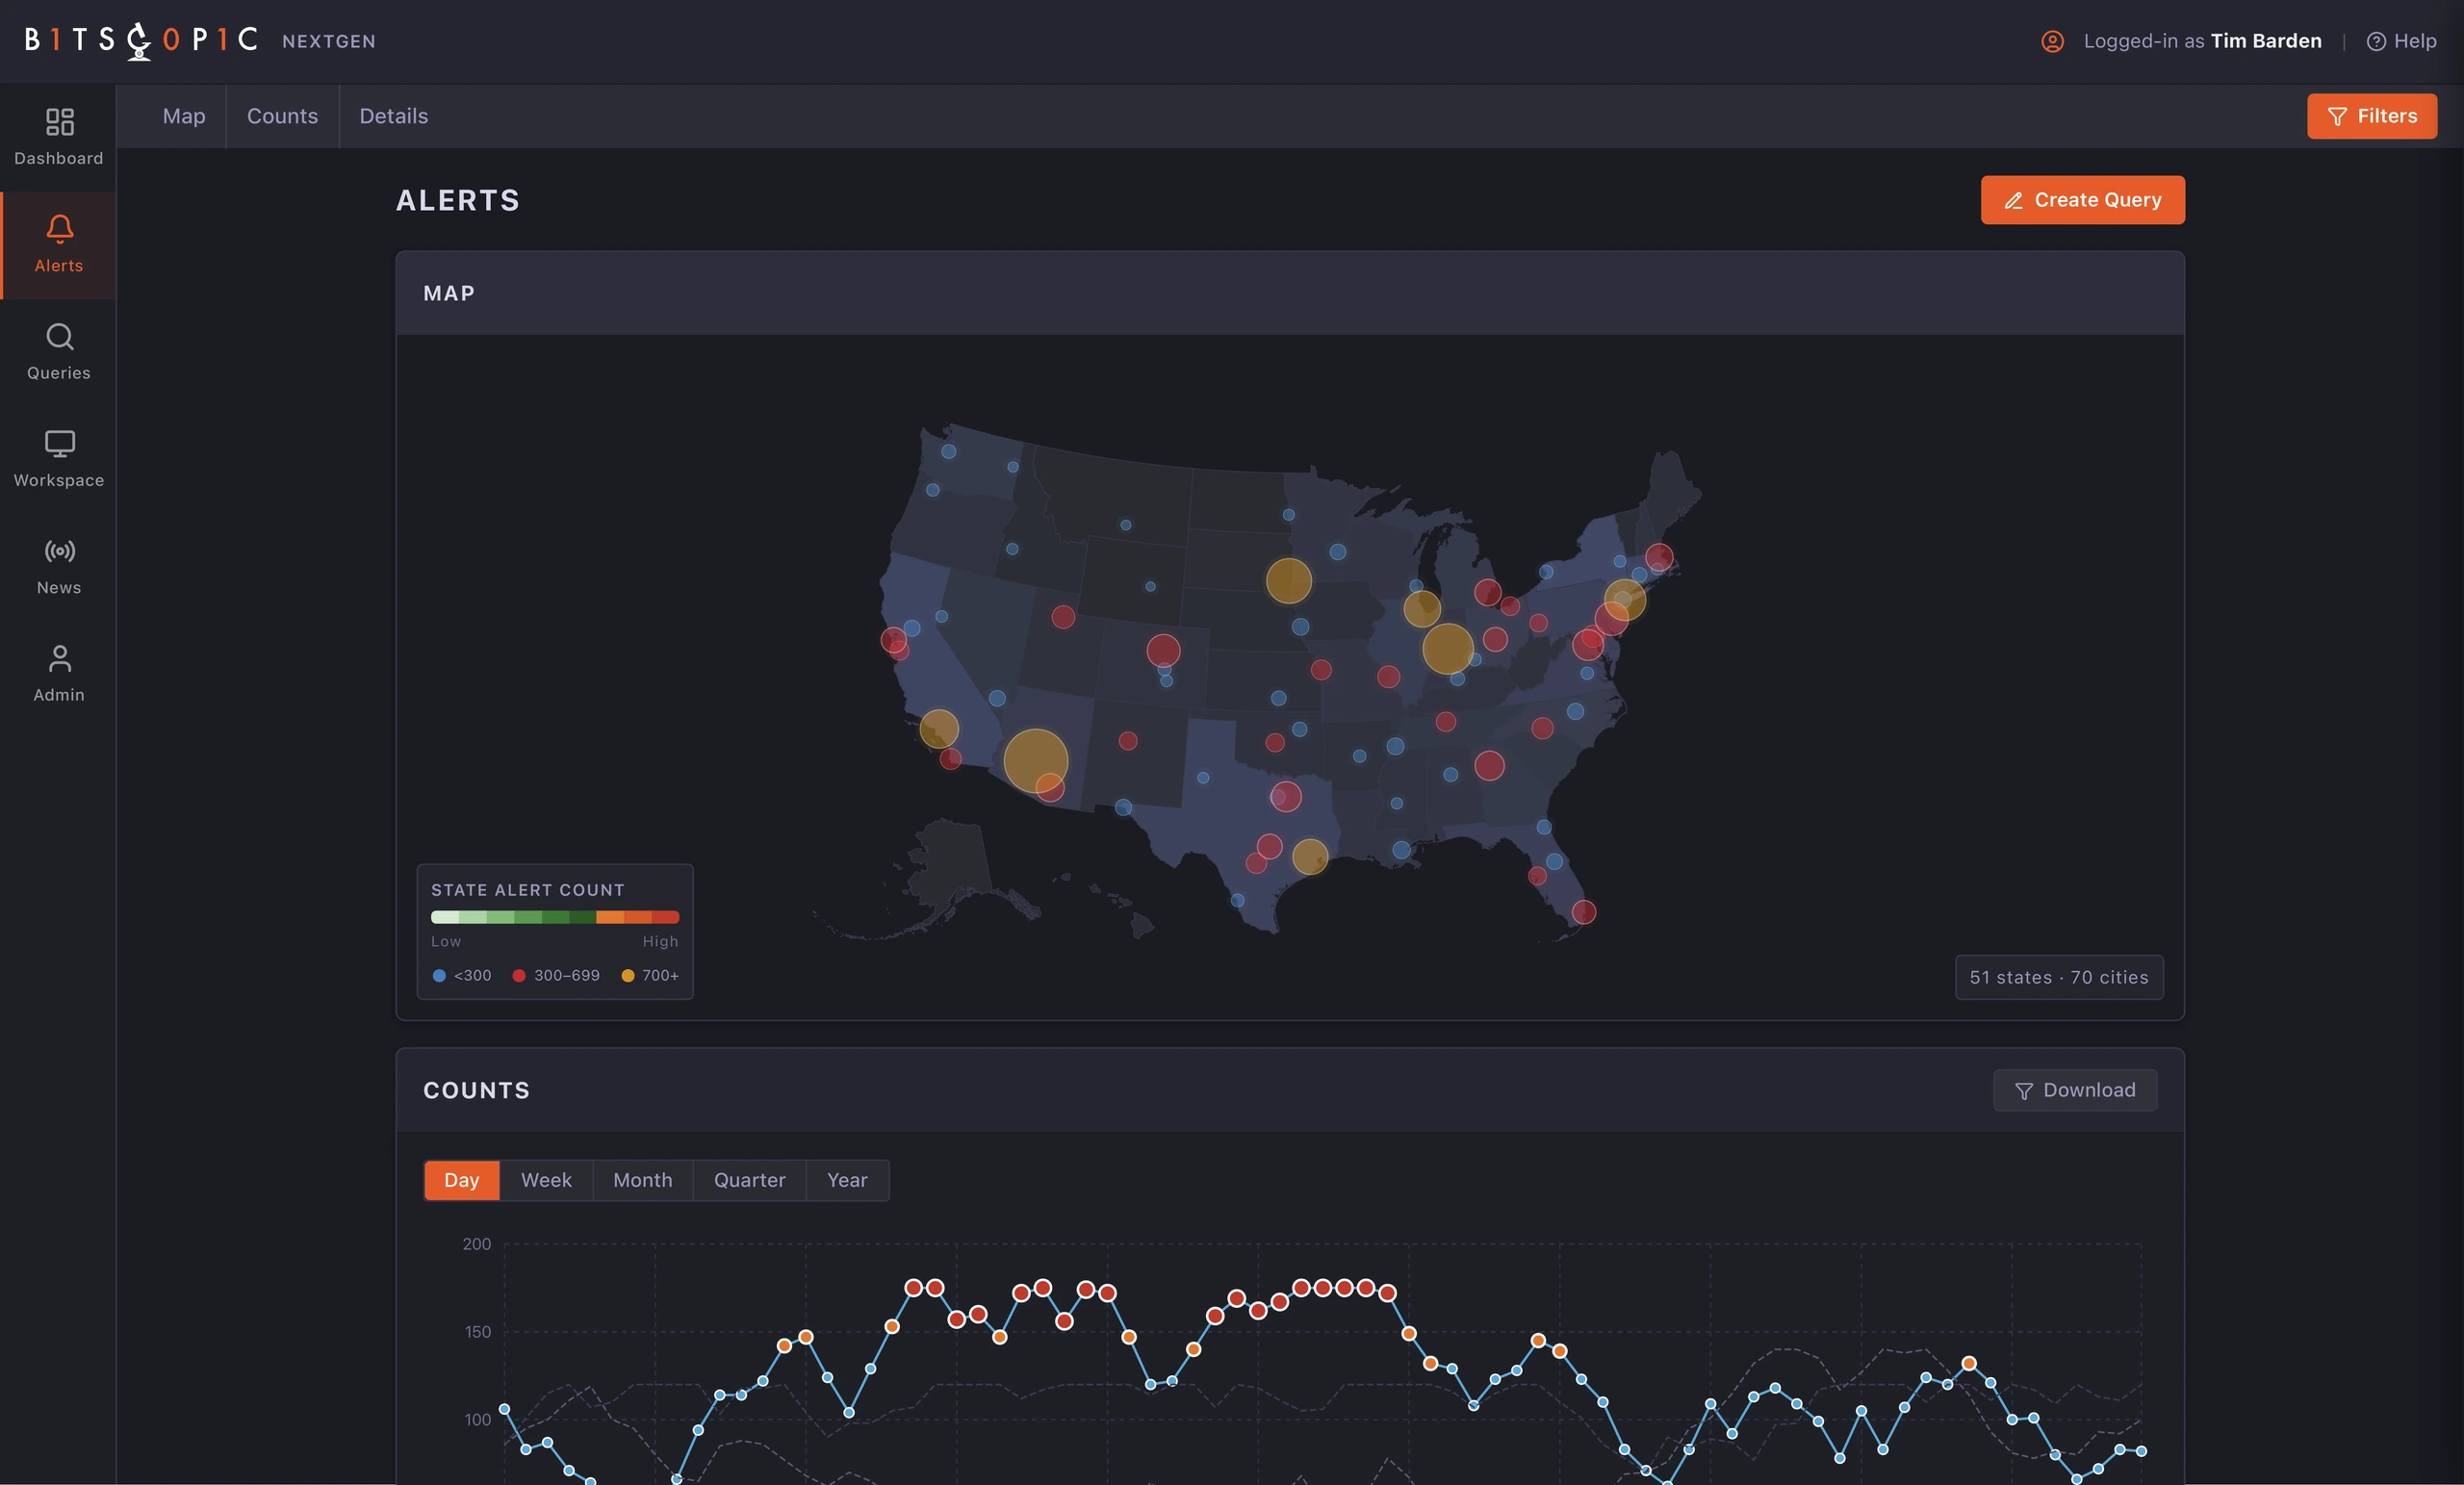
The Alerts workspace became the analyst’s working surface. It preserved the map context while adding count trends and query creation, so analysts could move from observation into investigation.
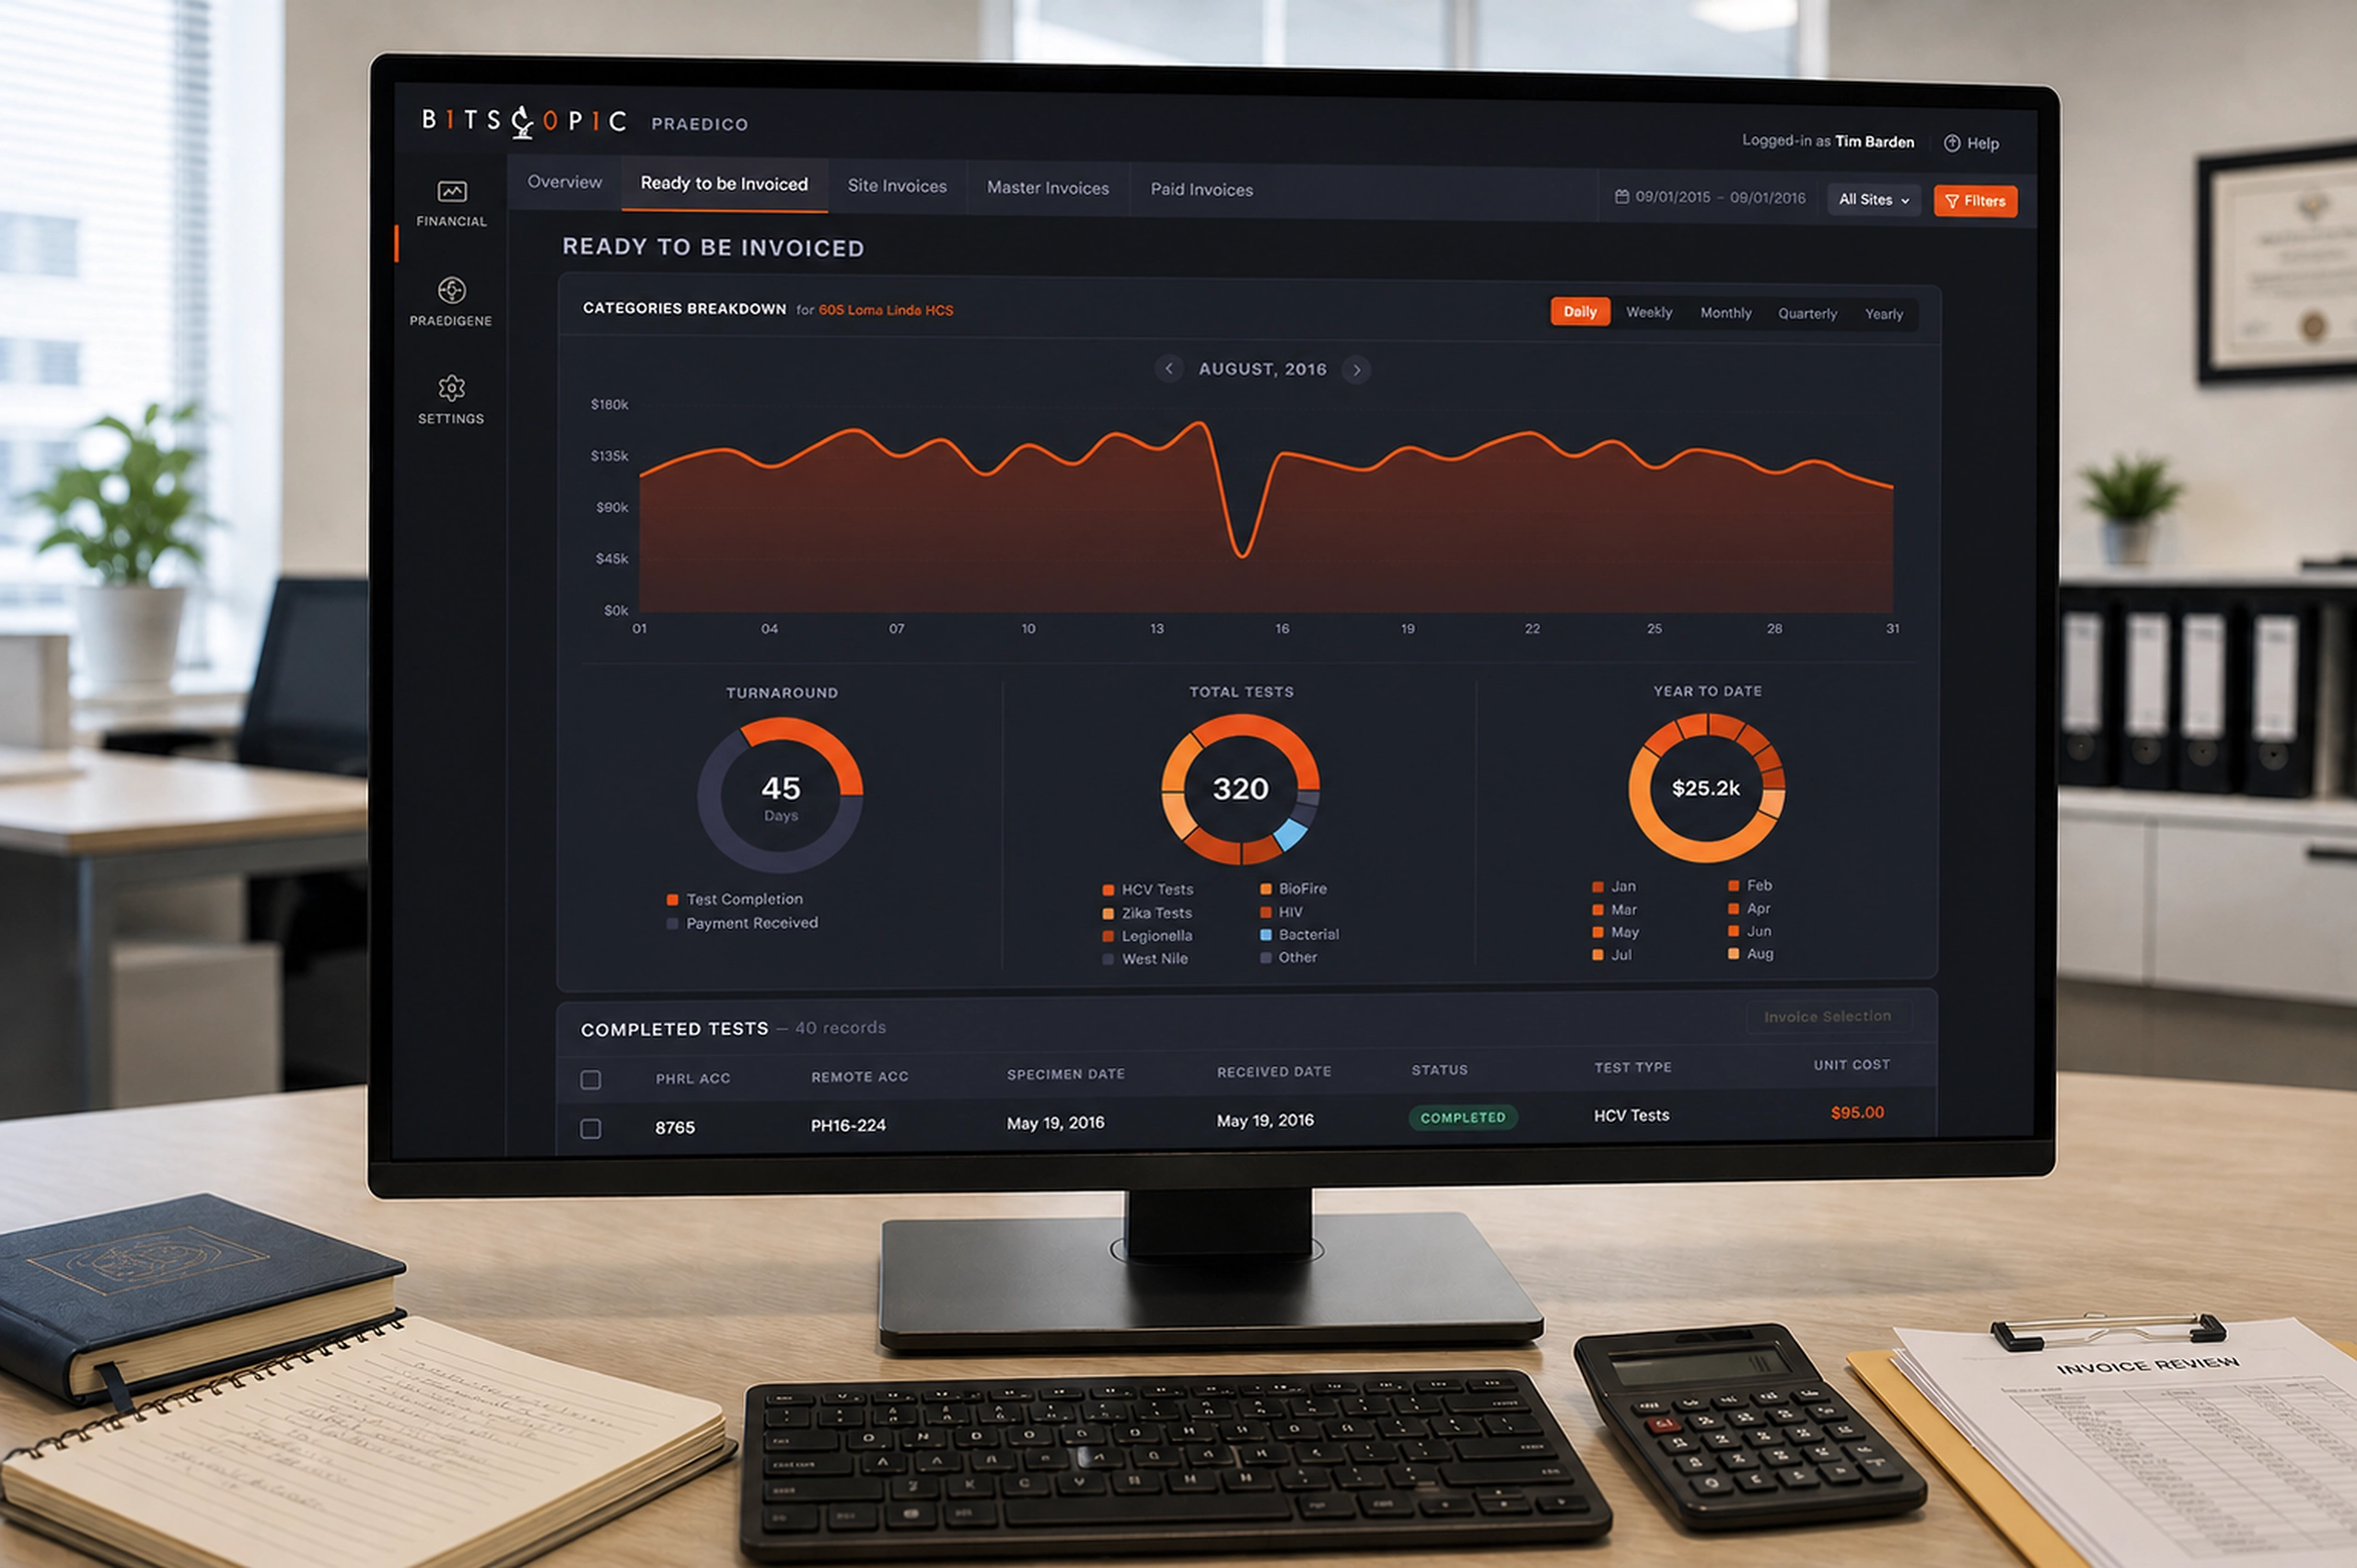
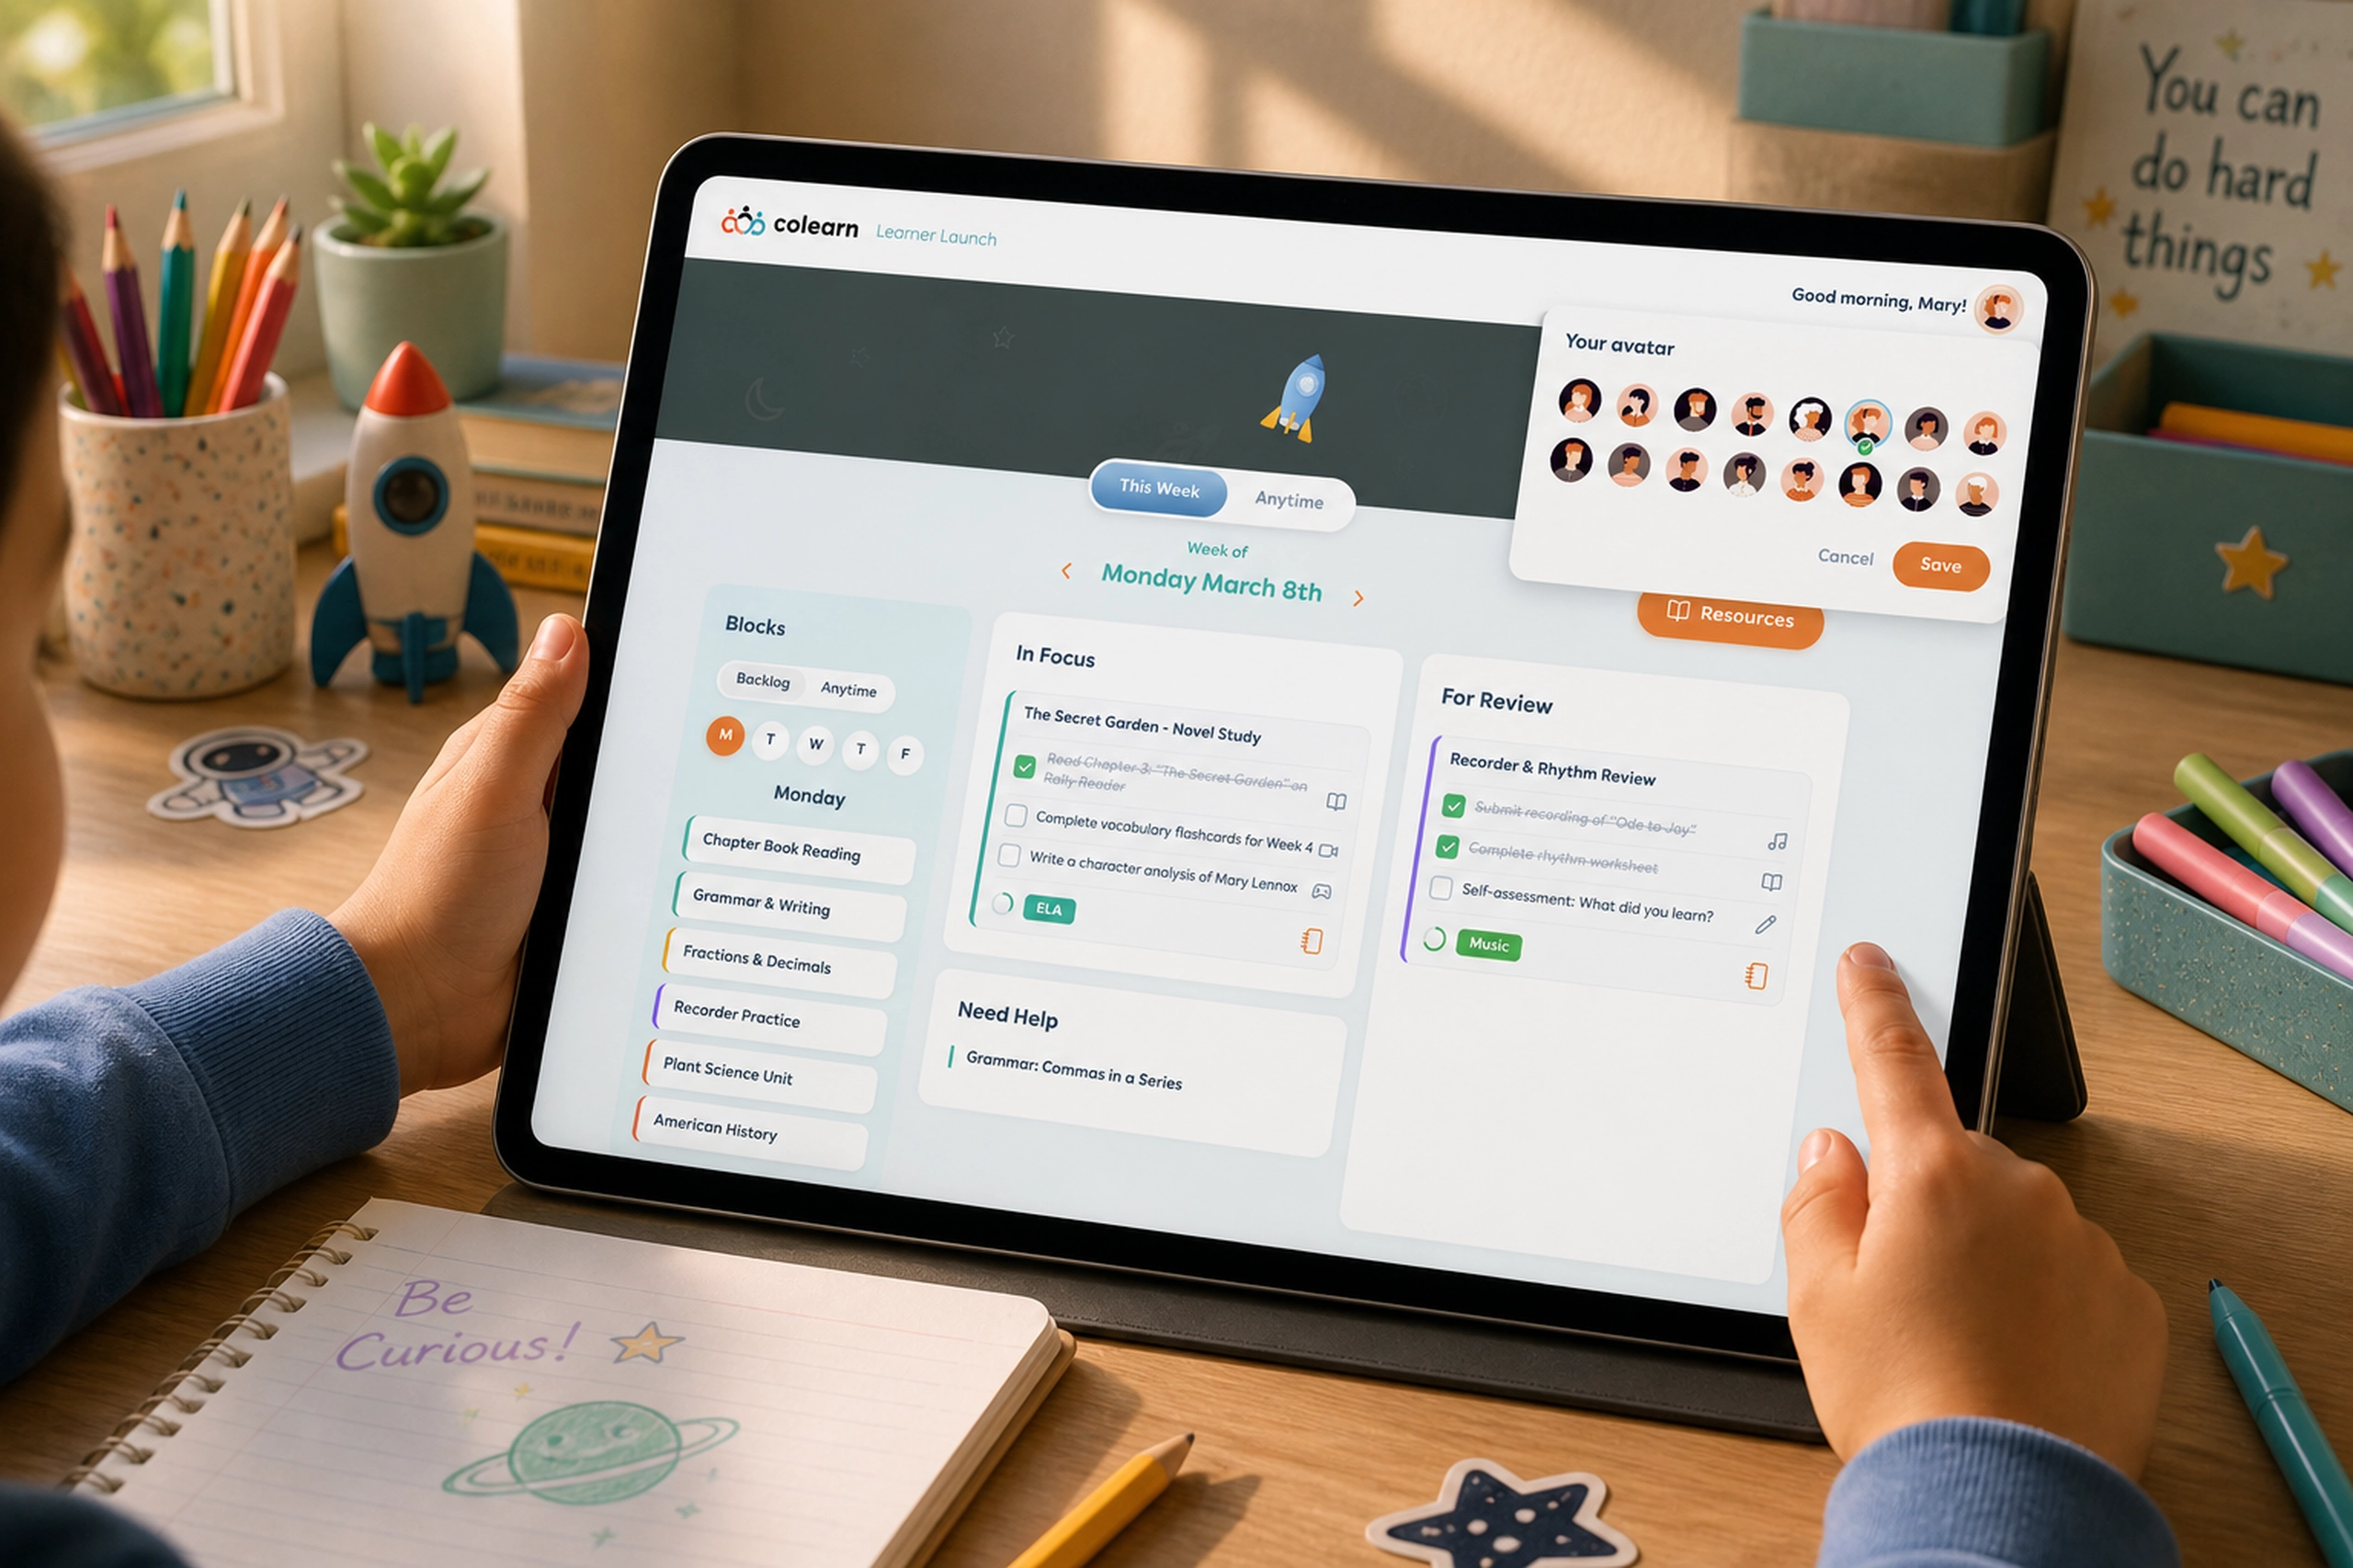
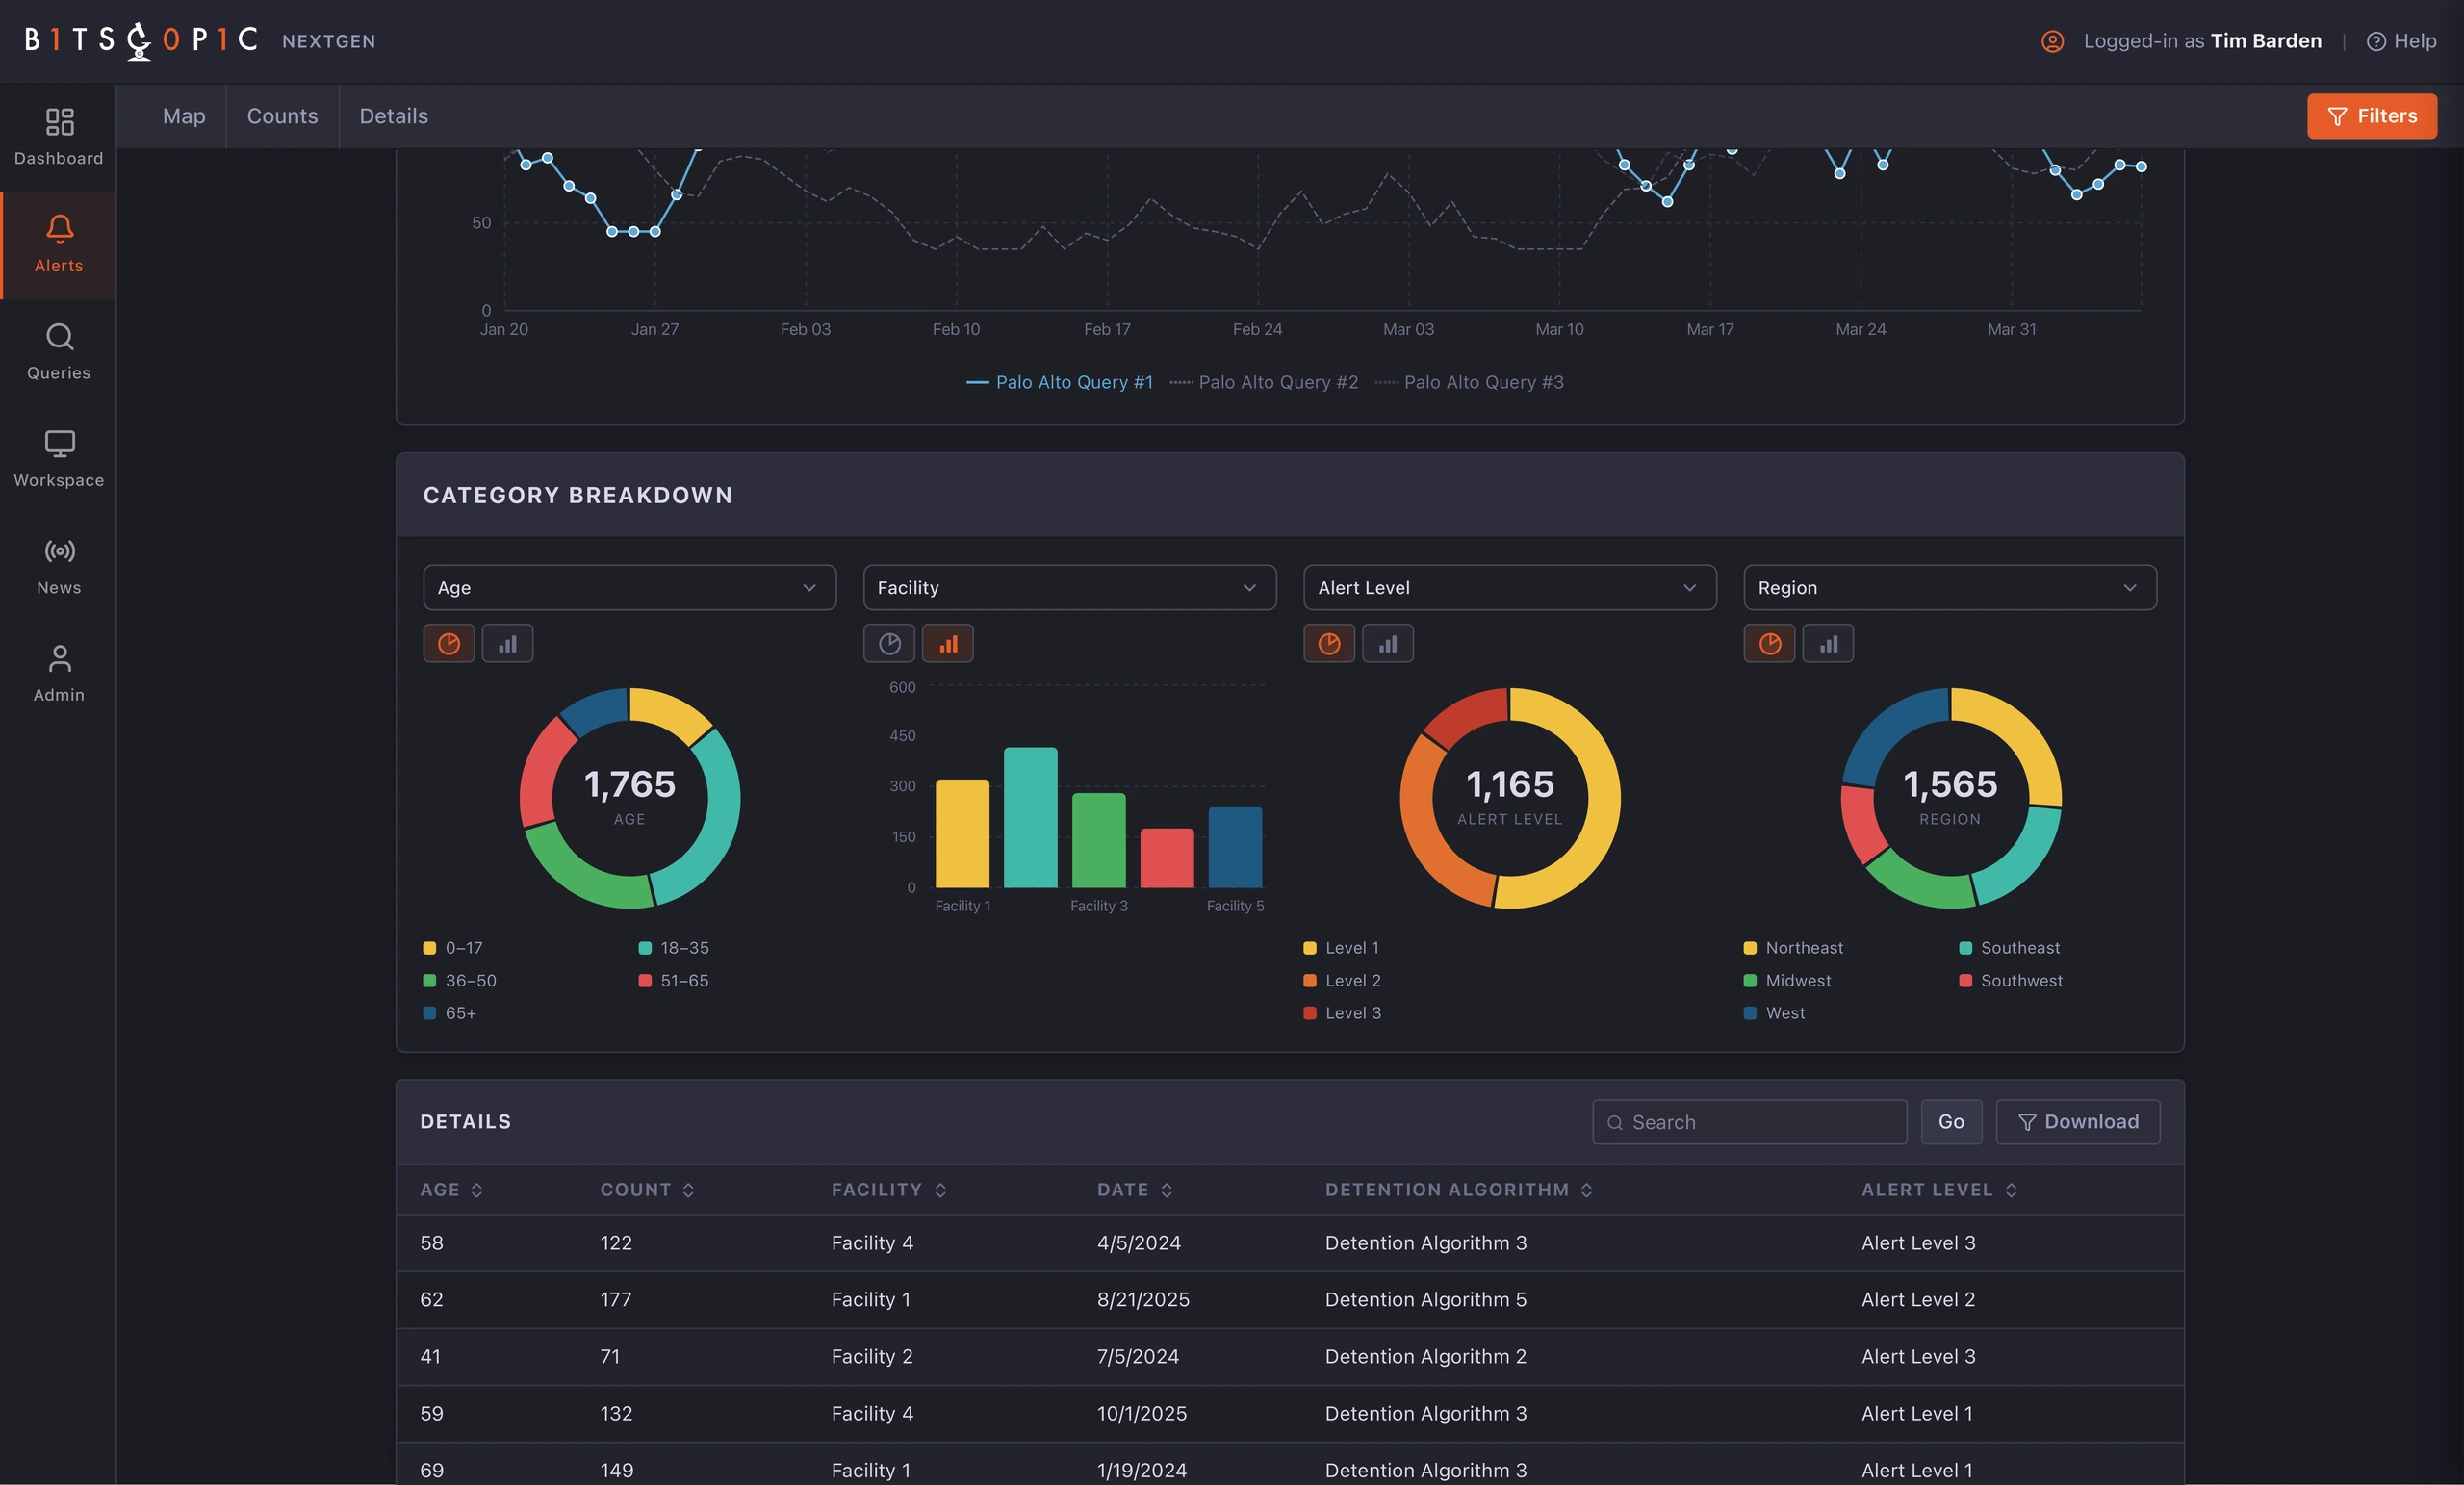
The category breakdown view added interpretation. Analysts could compare patterns by age, facility, alert level, and region, then inspect the supporting records below.
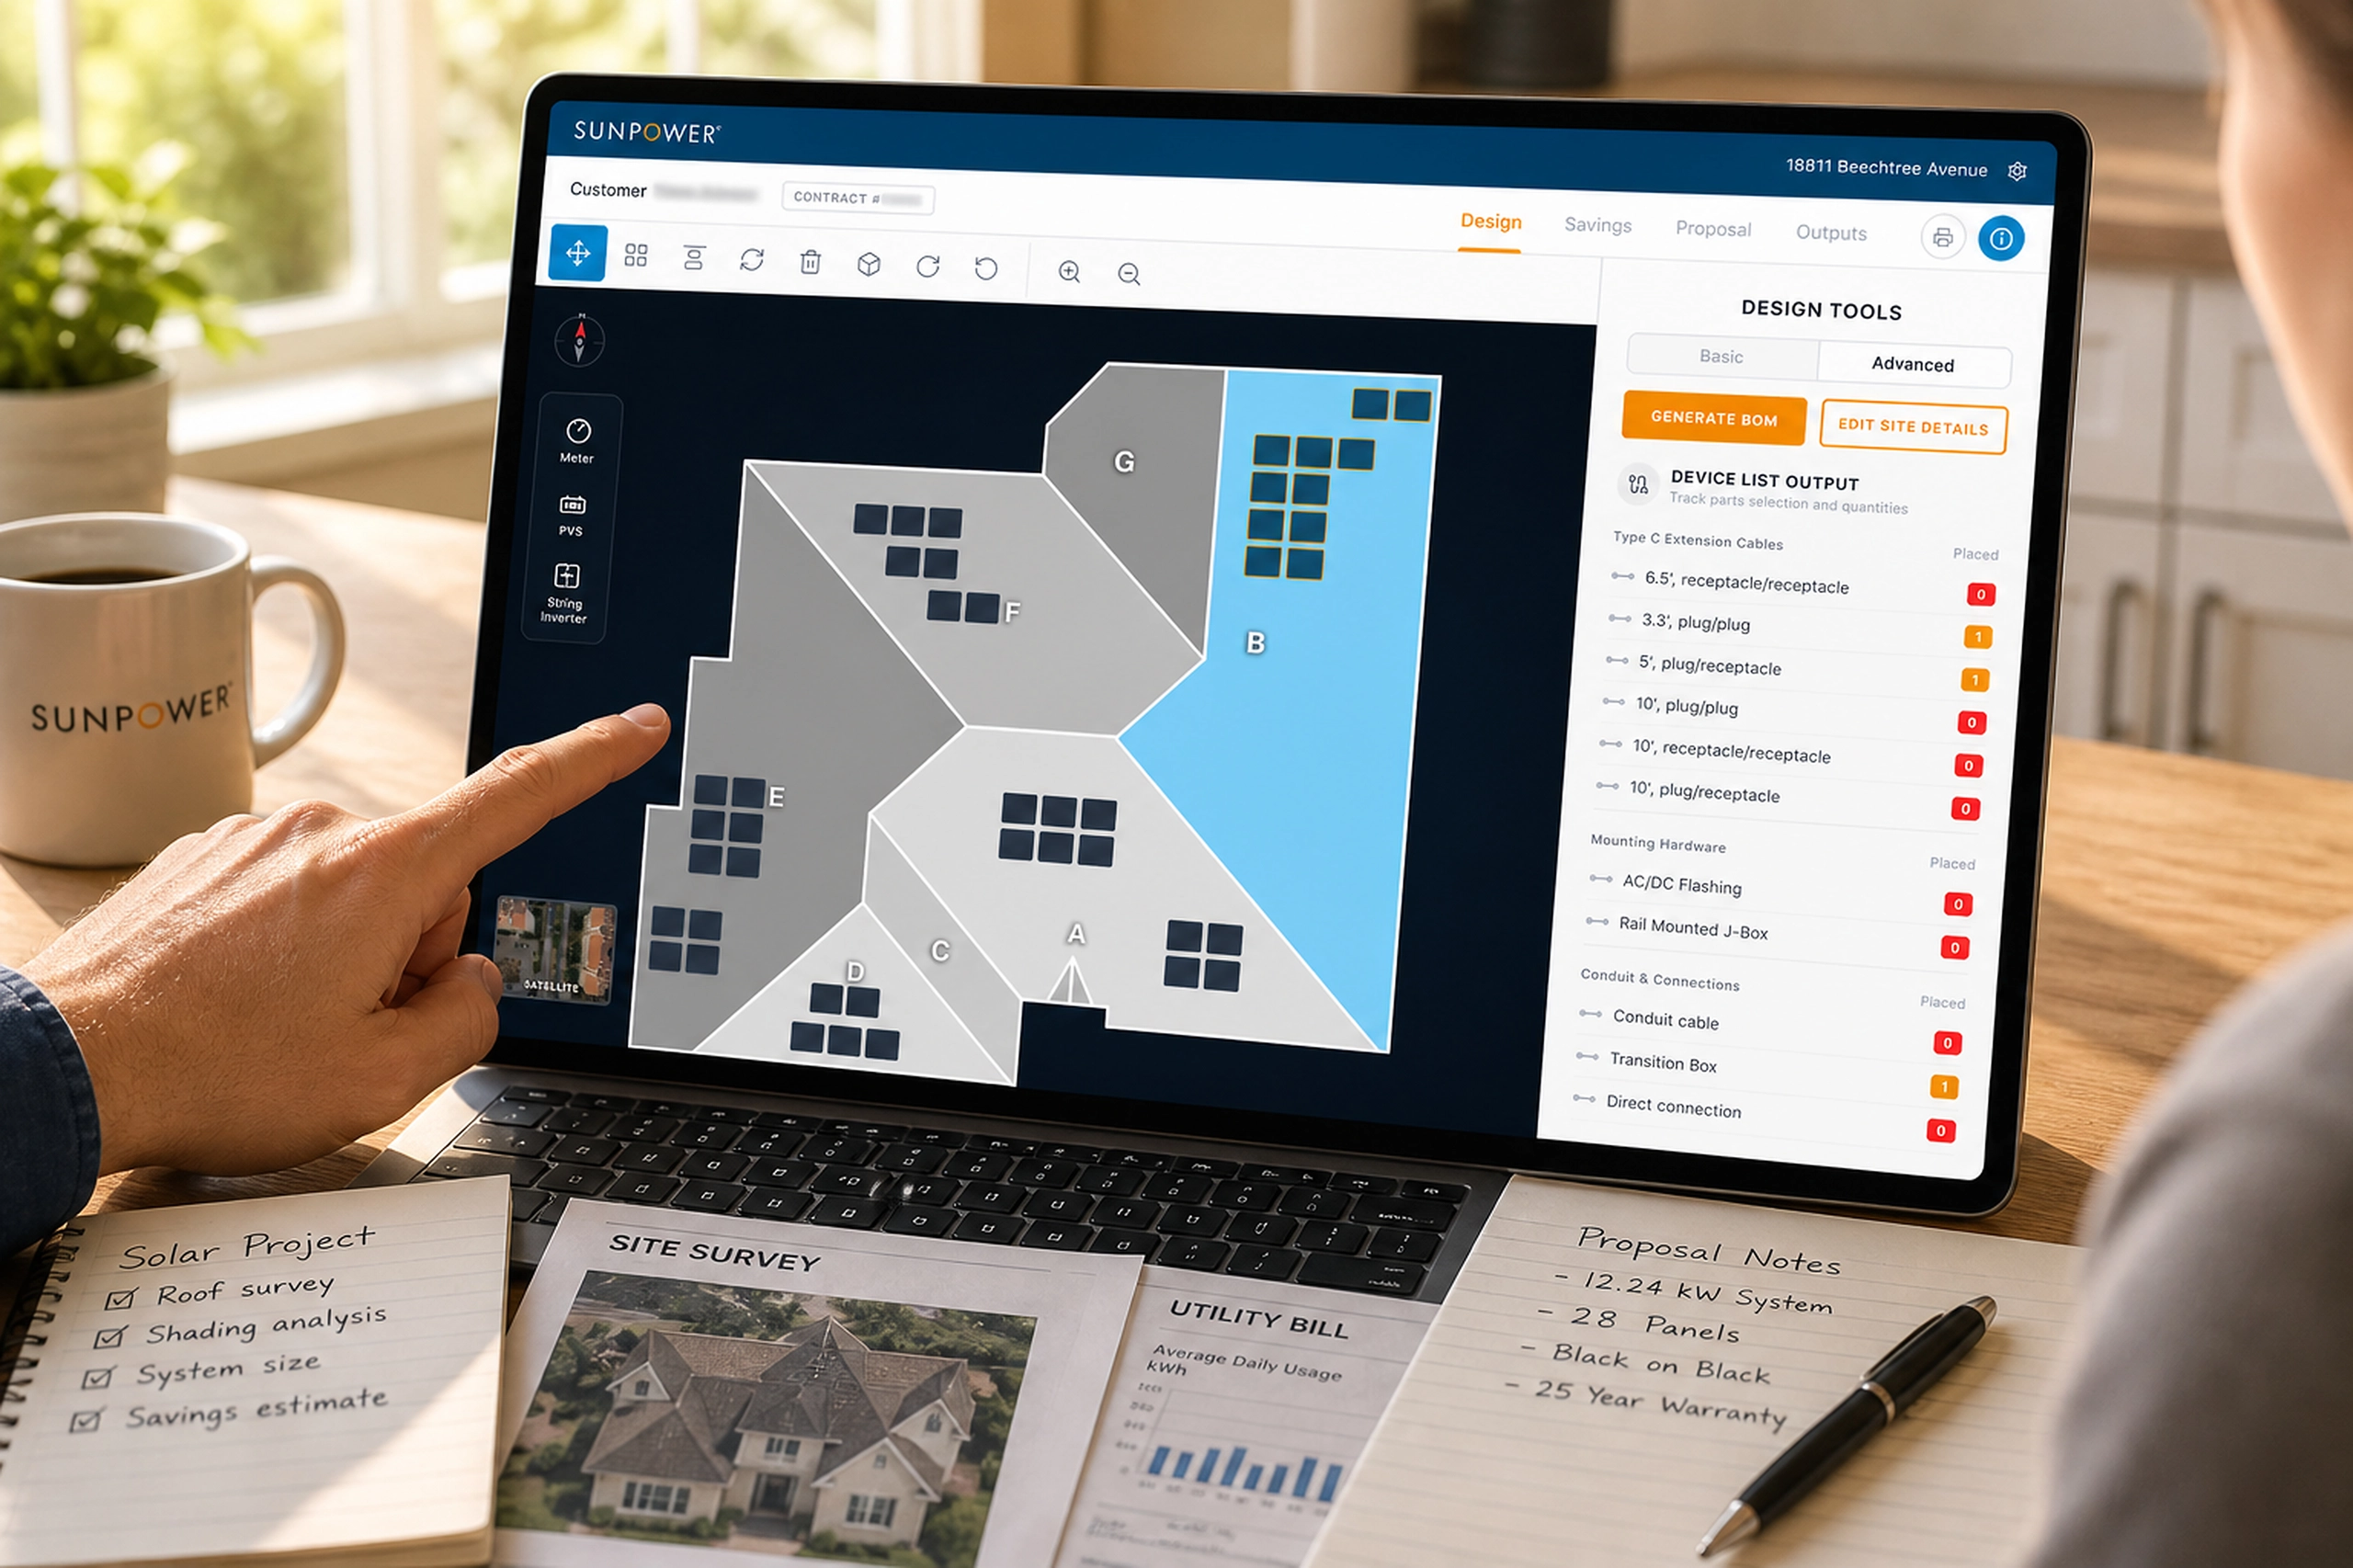
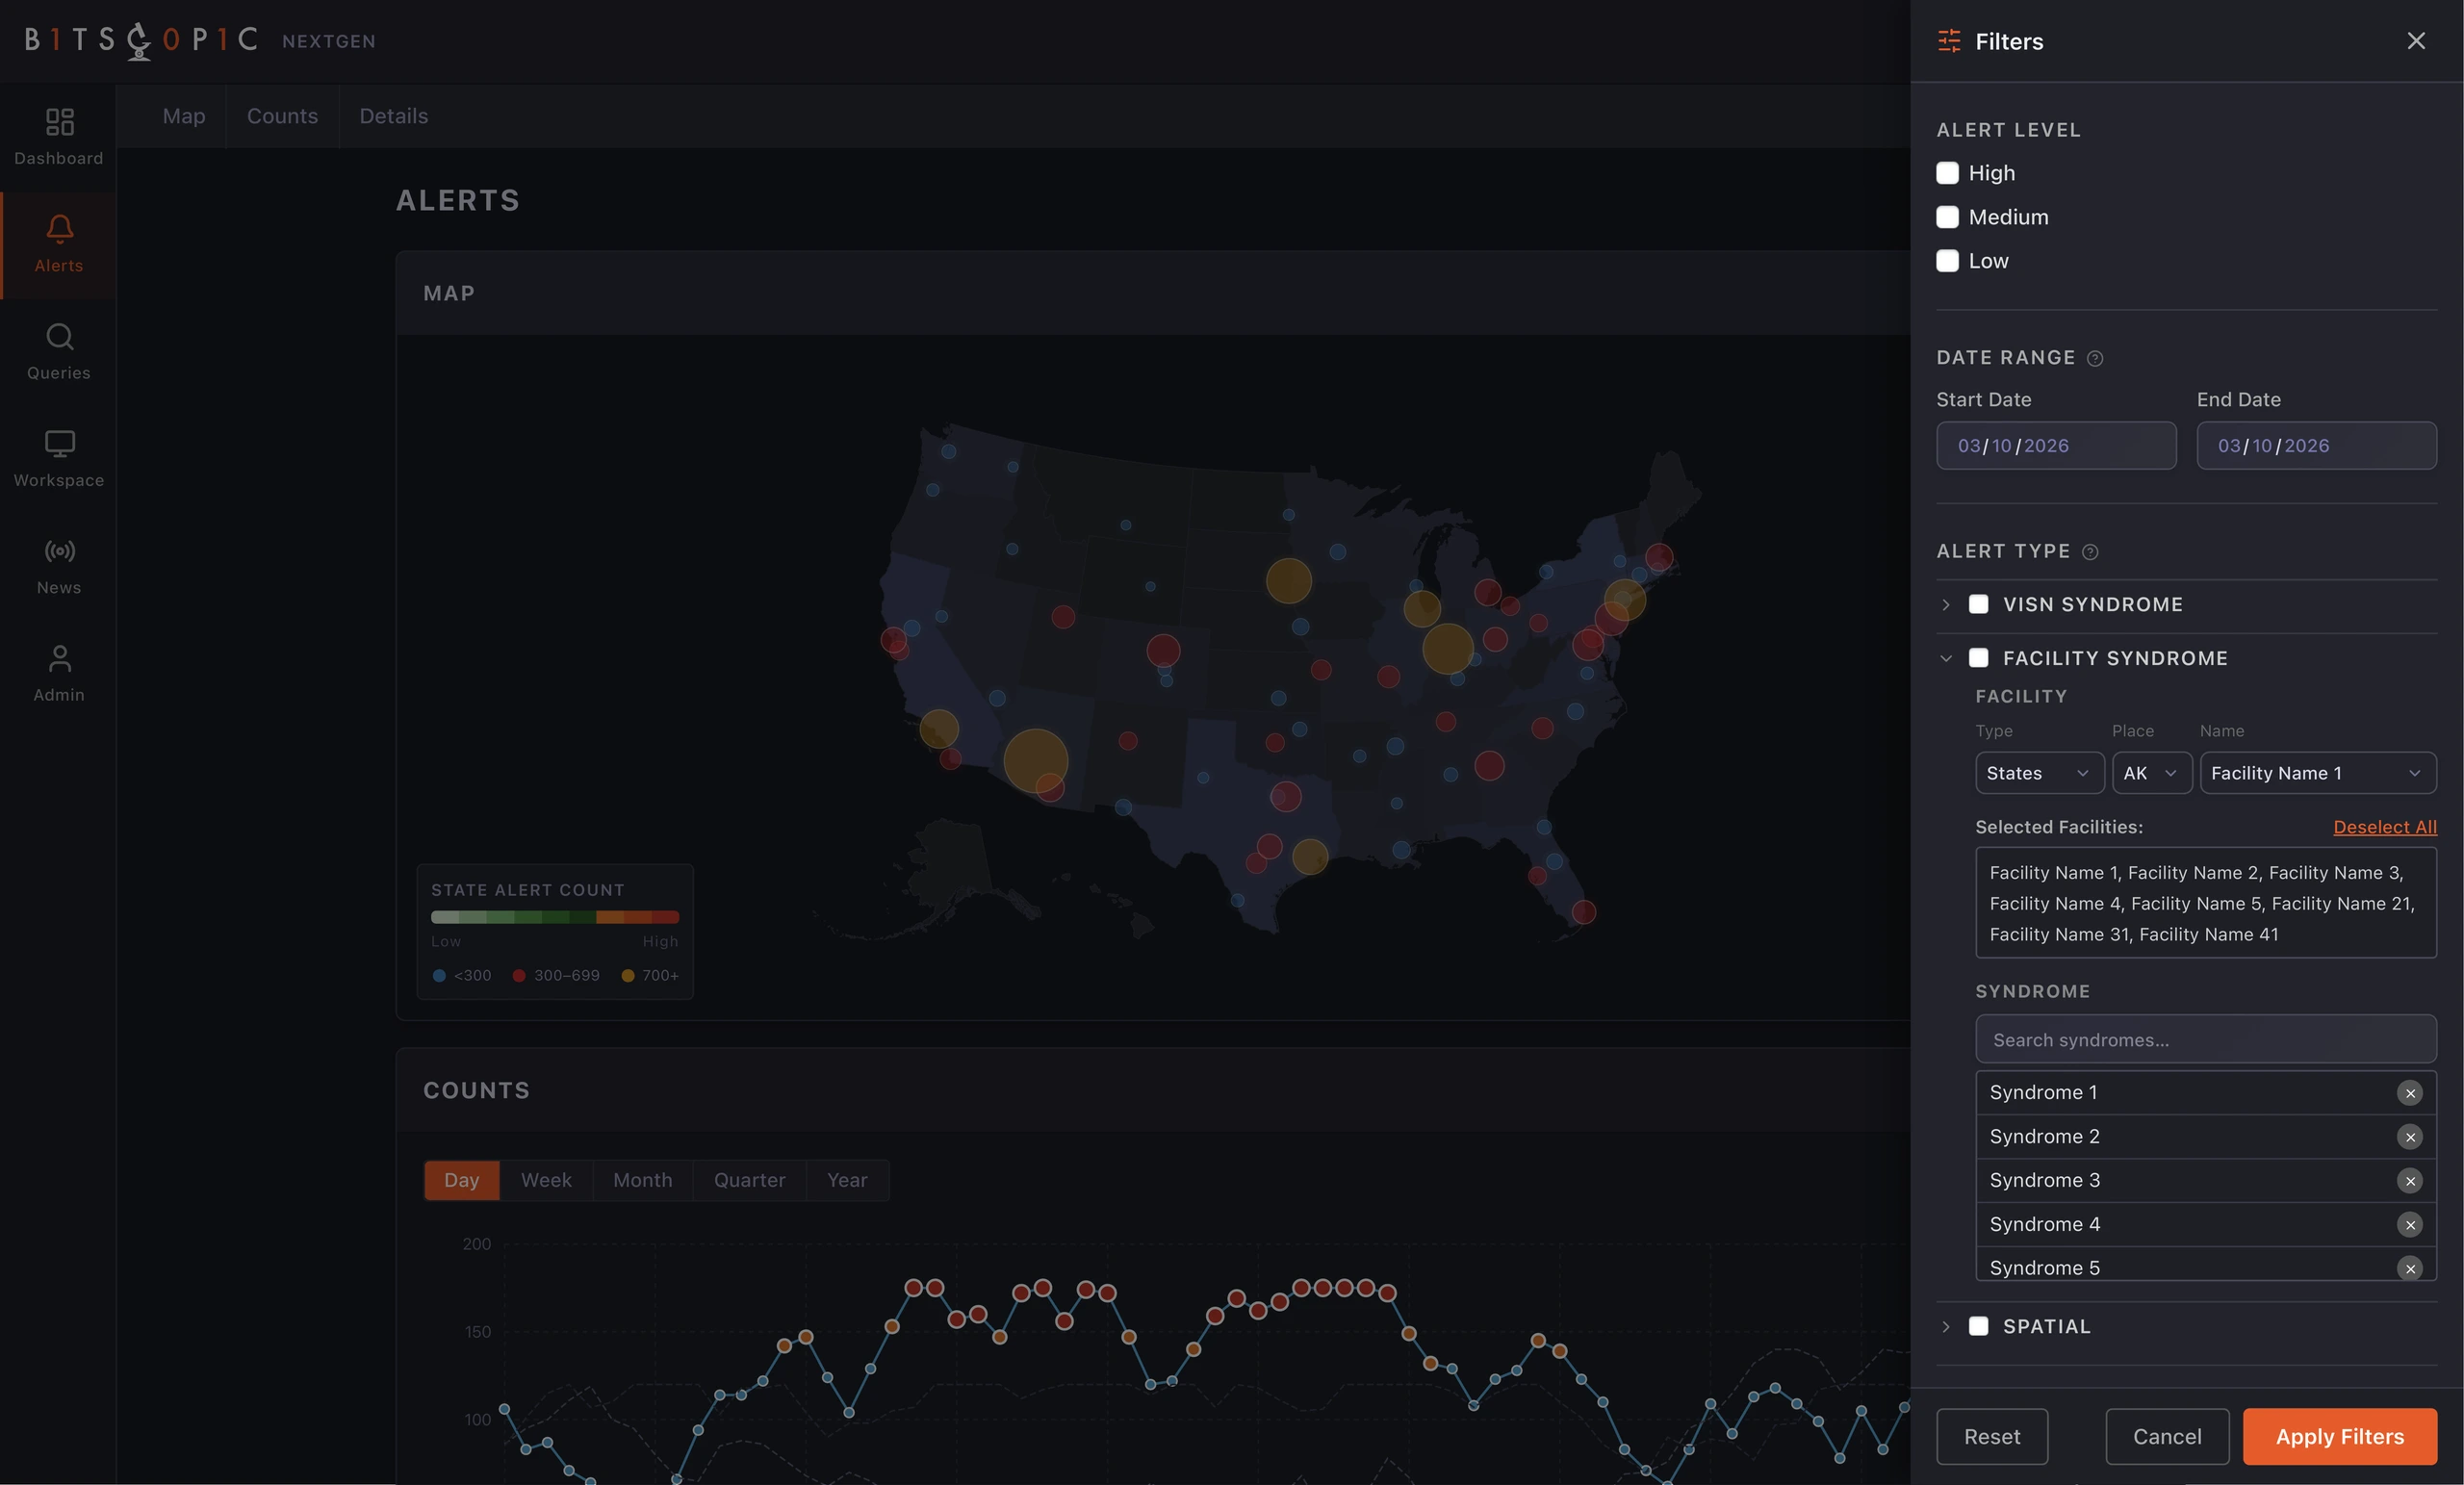
Filtering was the core interaction layer. Public health analysts do not just browse data, they ask increasingly specific questions.
The filter panel made that narrowing process visible. Analysts could isolate alerts by severity, date range, facility, syndrome, alert type, and spatial criteria without leaving the investigation context.
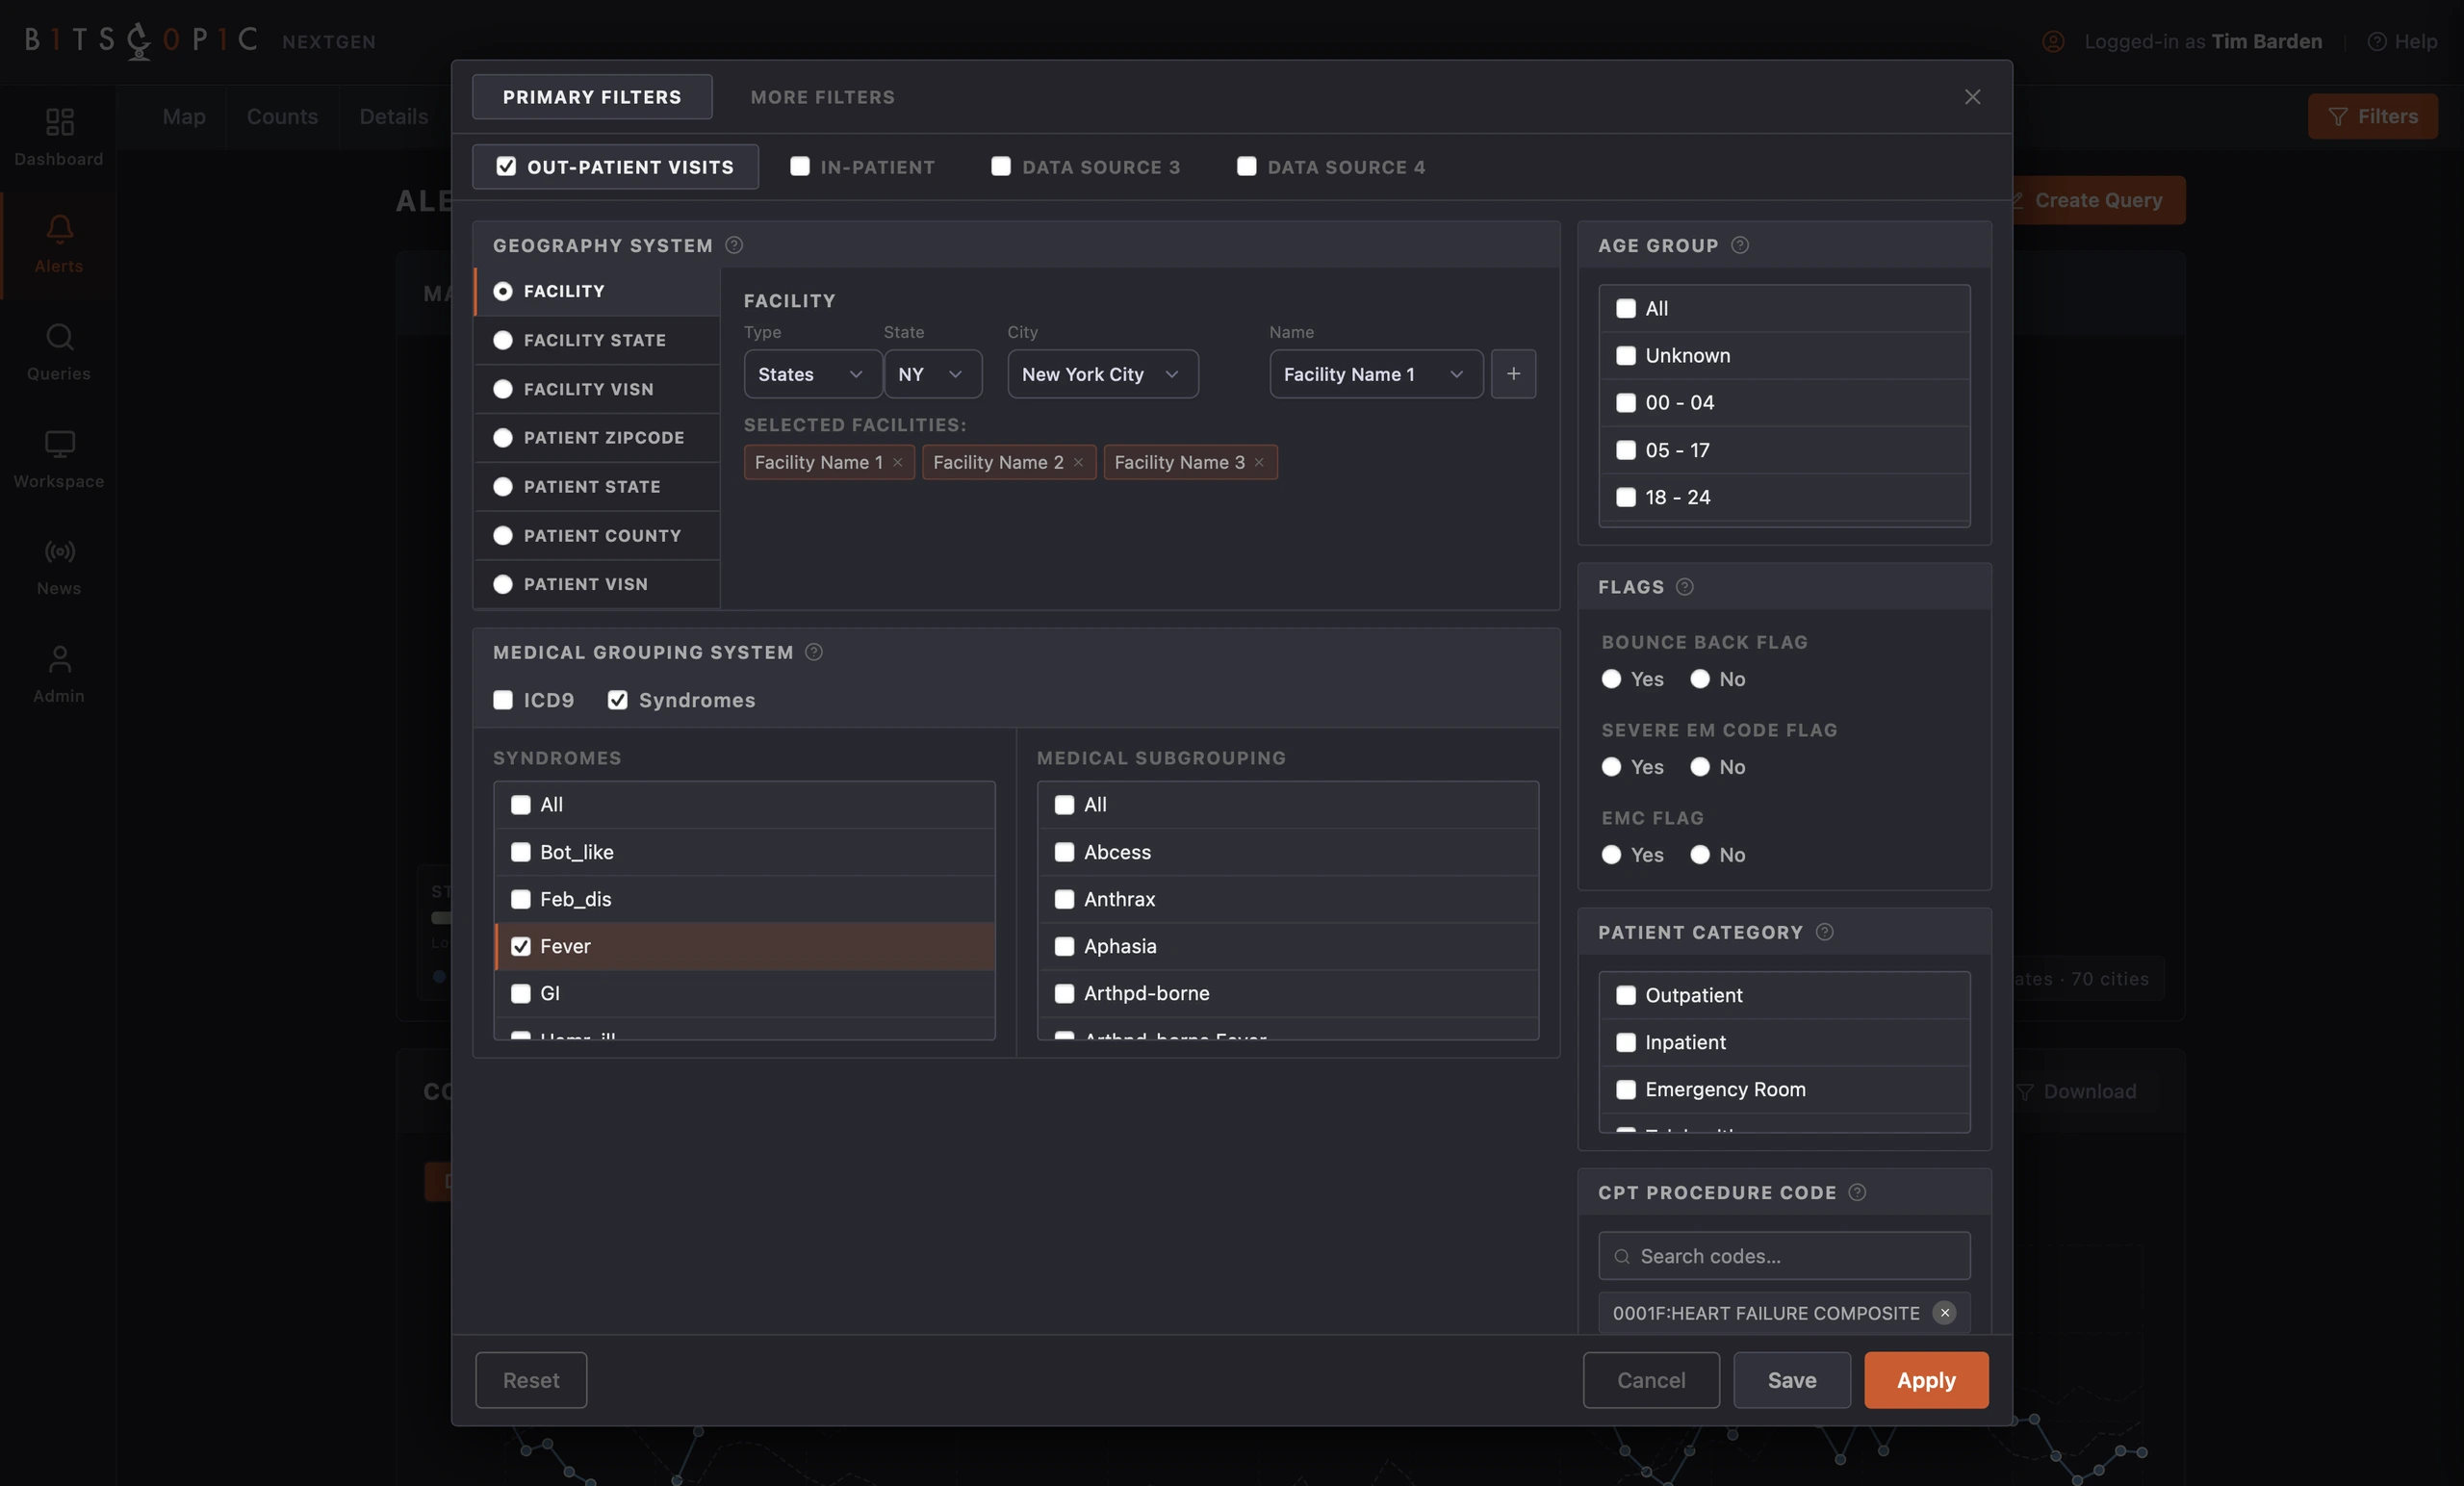
For deeper analysis, the advanced filter modal organized complex criteria into a structured query-building workspace. Geography, medical grouping, age, flags, patient category, and procedure codes were treated as parts of one investigation model.
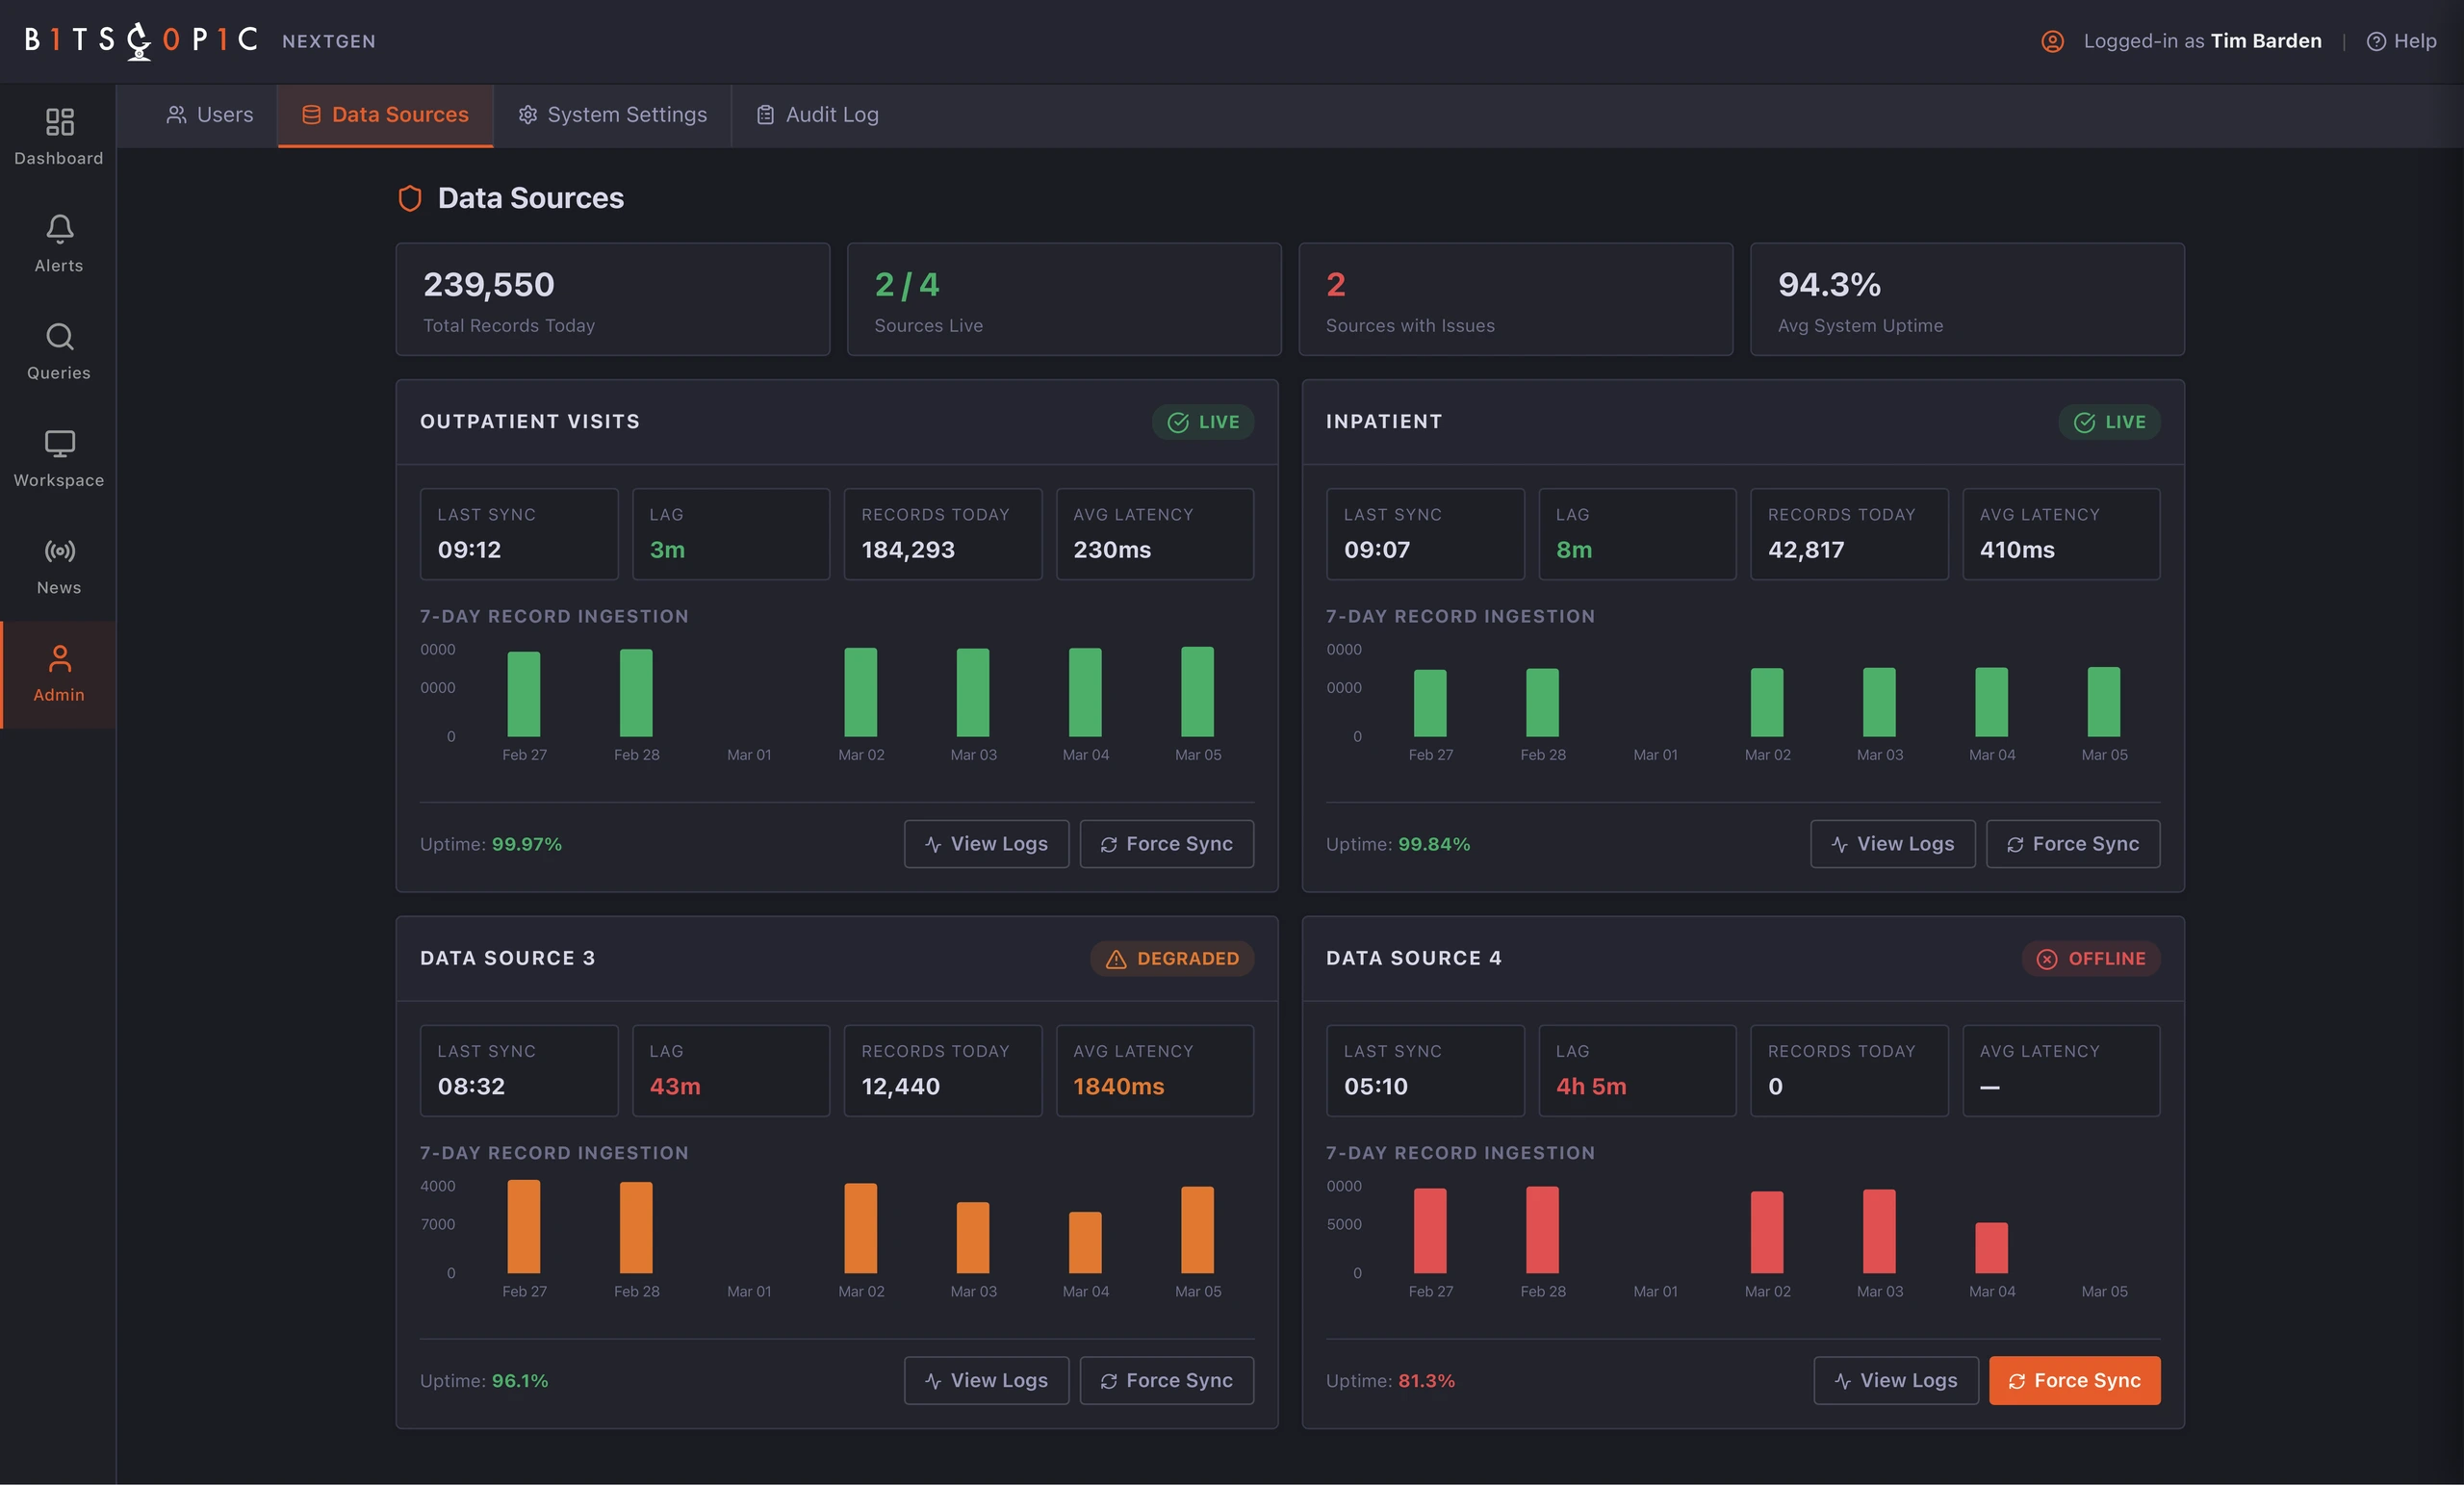
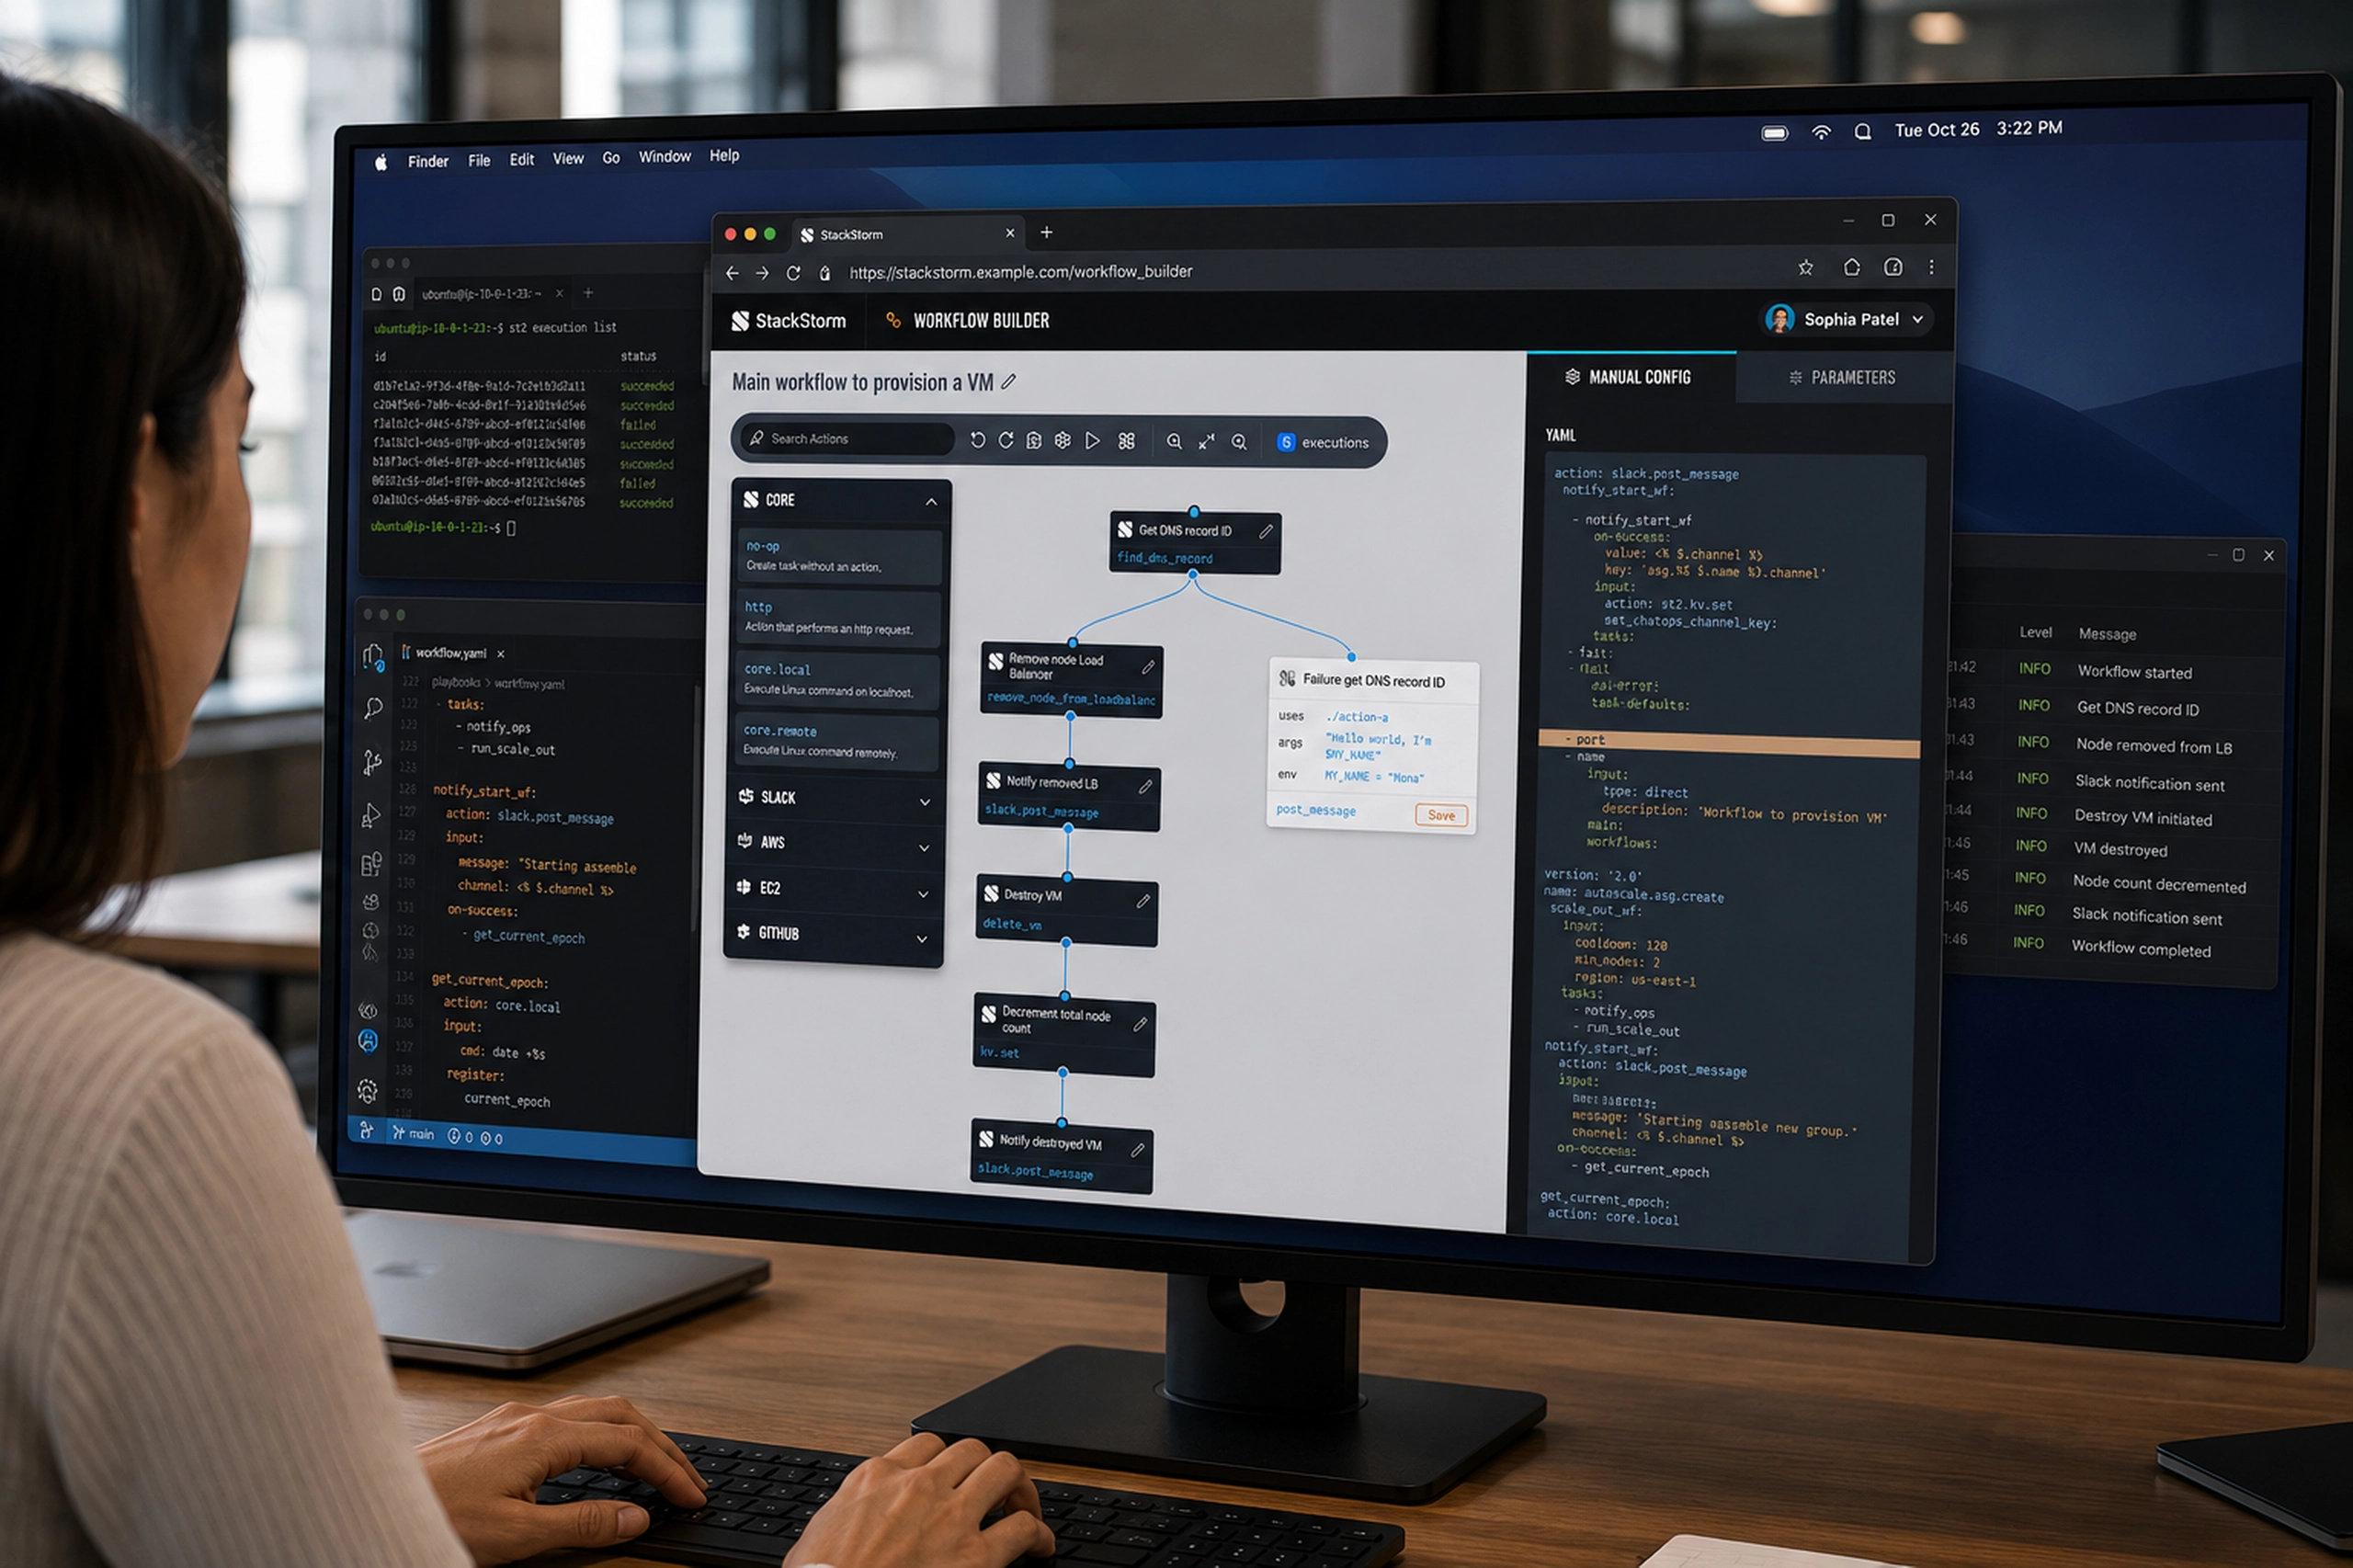
The Data Sources screen added a trust layer. A surveillance interface cannot be credible if analysts cannot see whether the incoming feeds are live, delayed, degraded, or offline.