Clients & Ventures
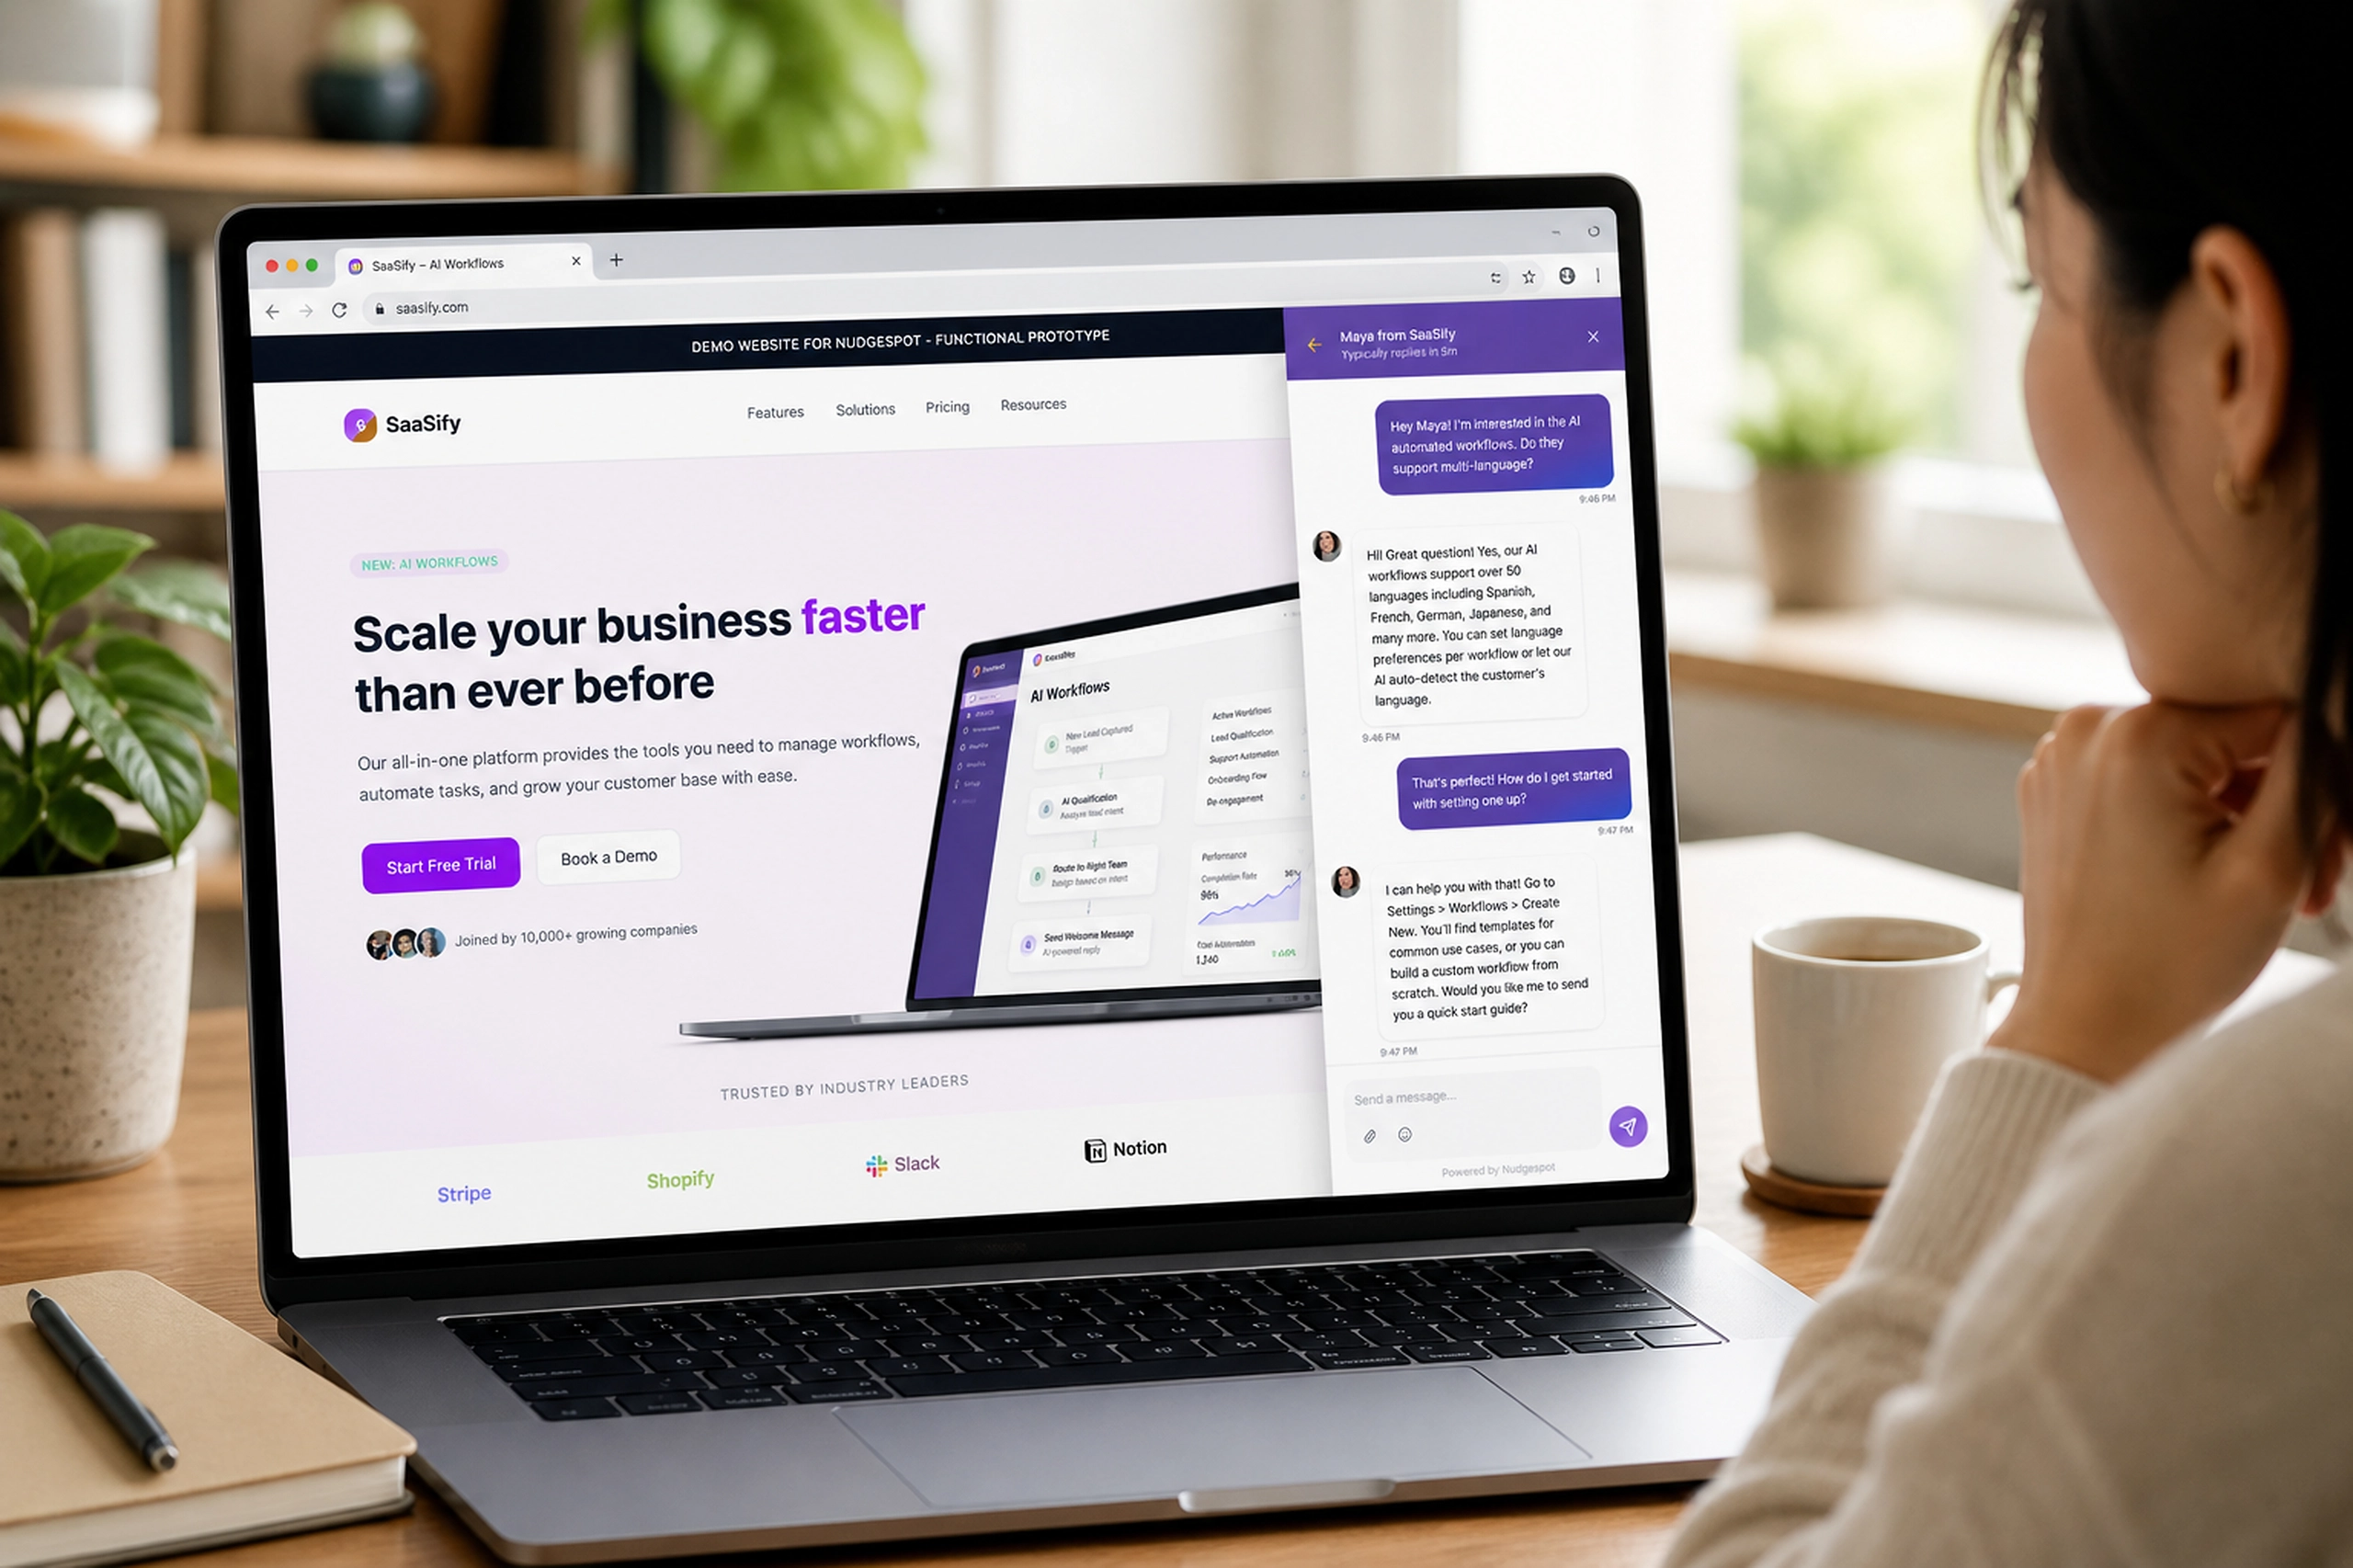
Product/systems design that turns AI tech into business results


Contact Us
Contact form or information will go here.
Project Detail
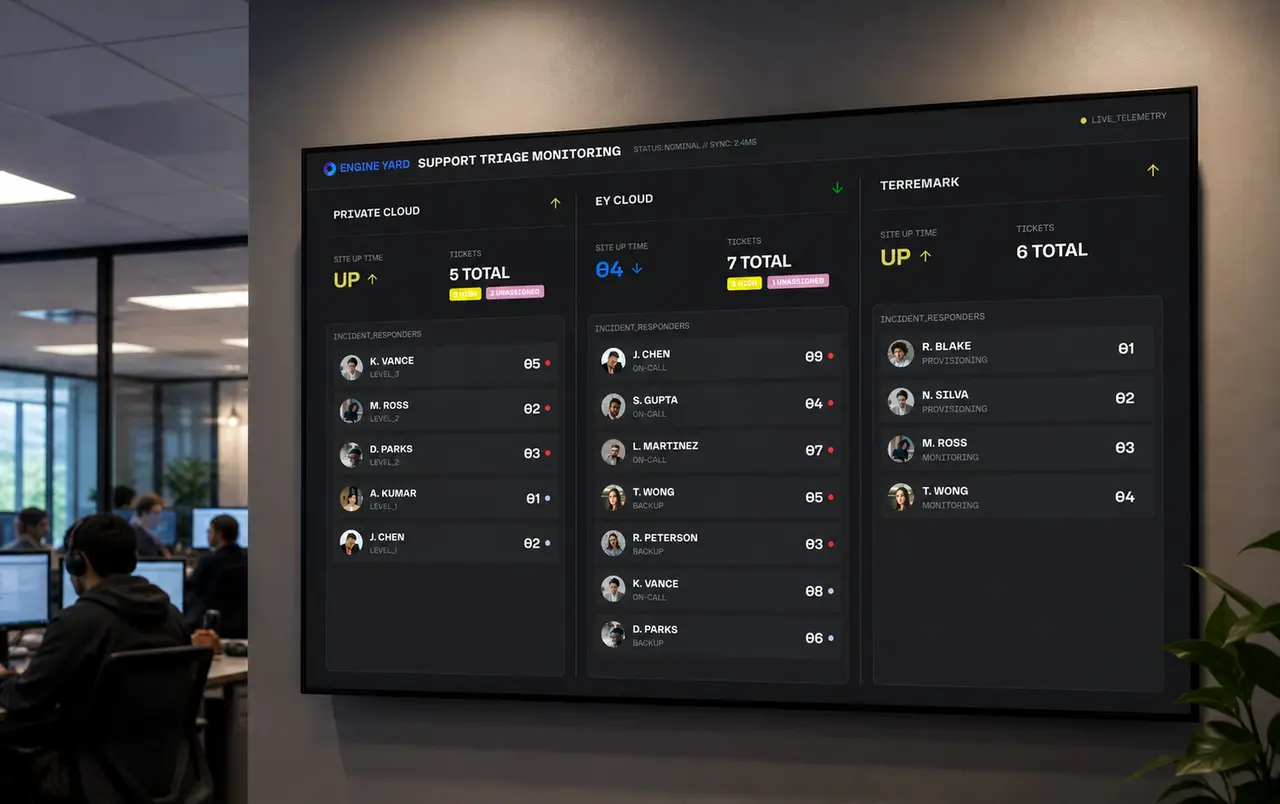
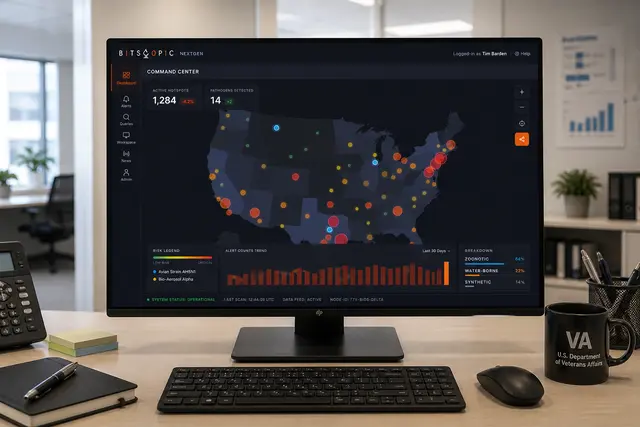
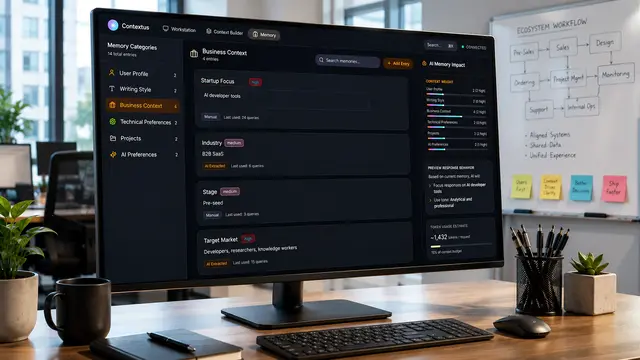
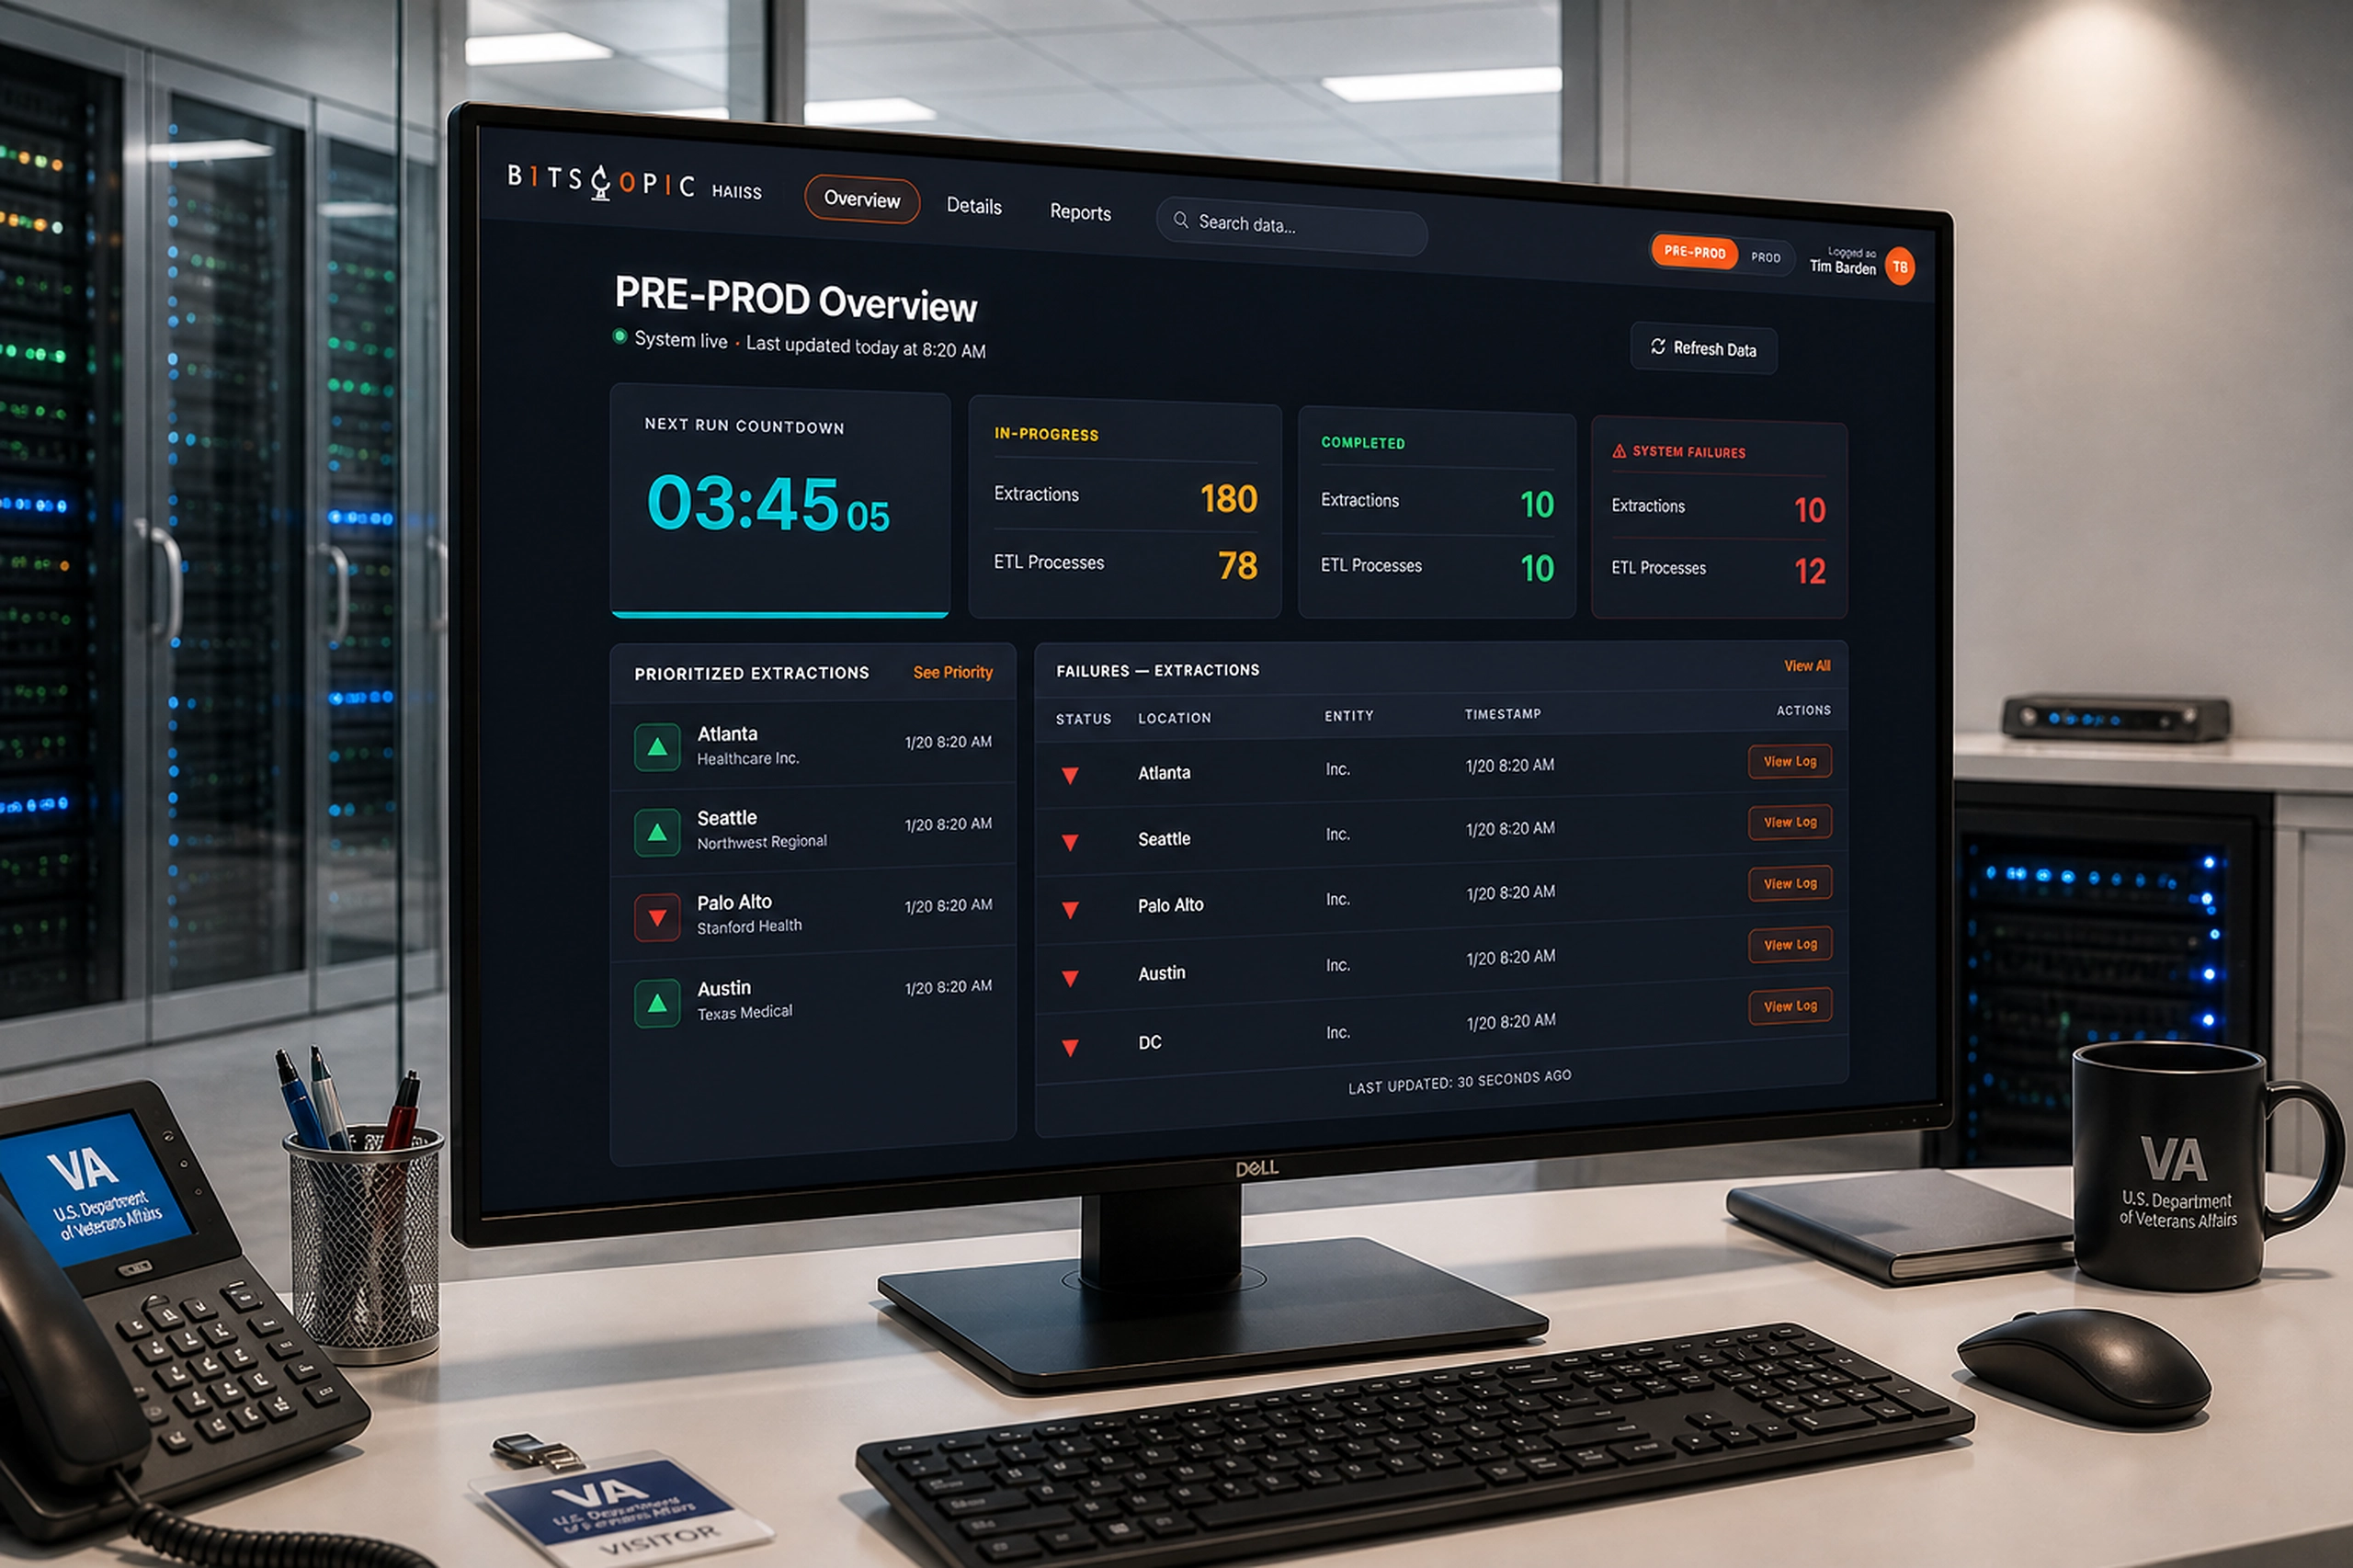
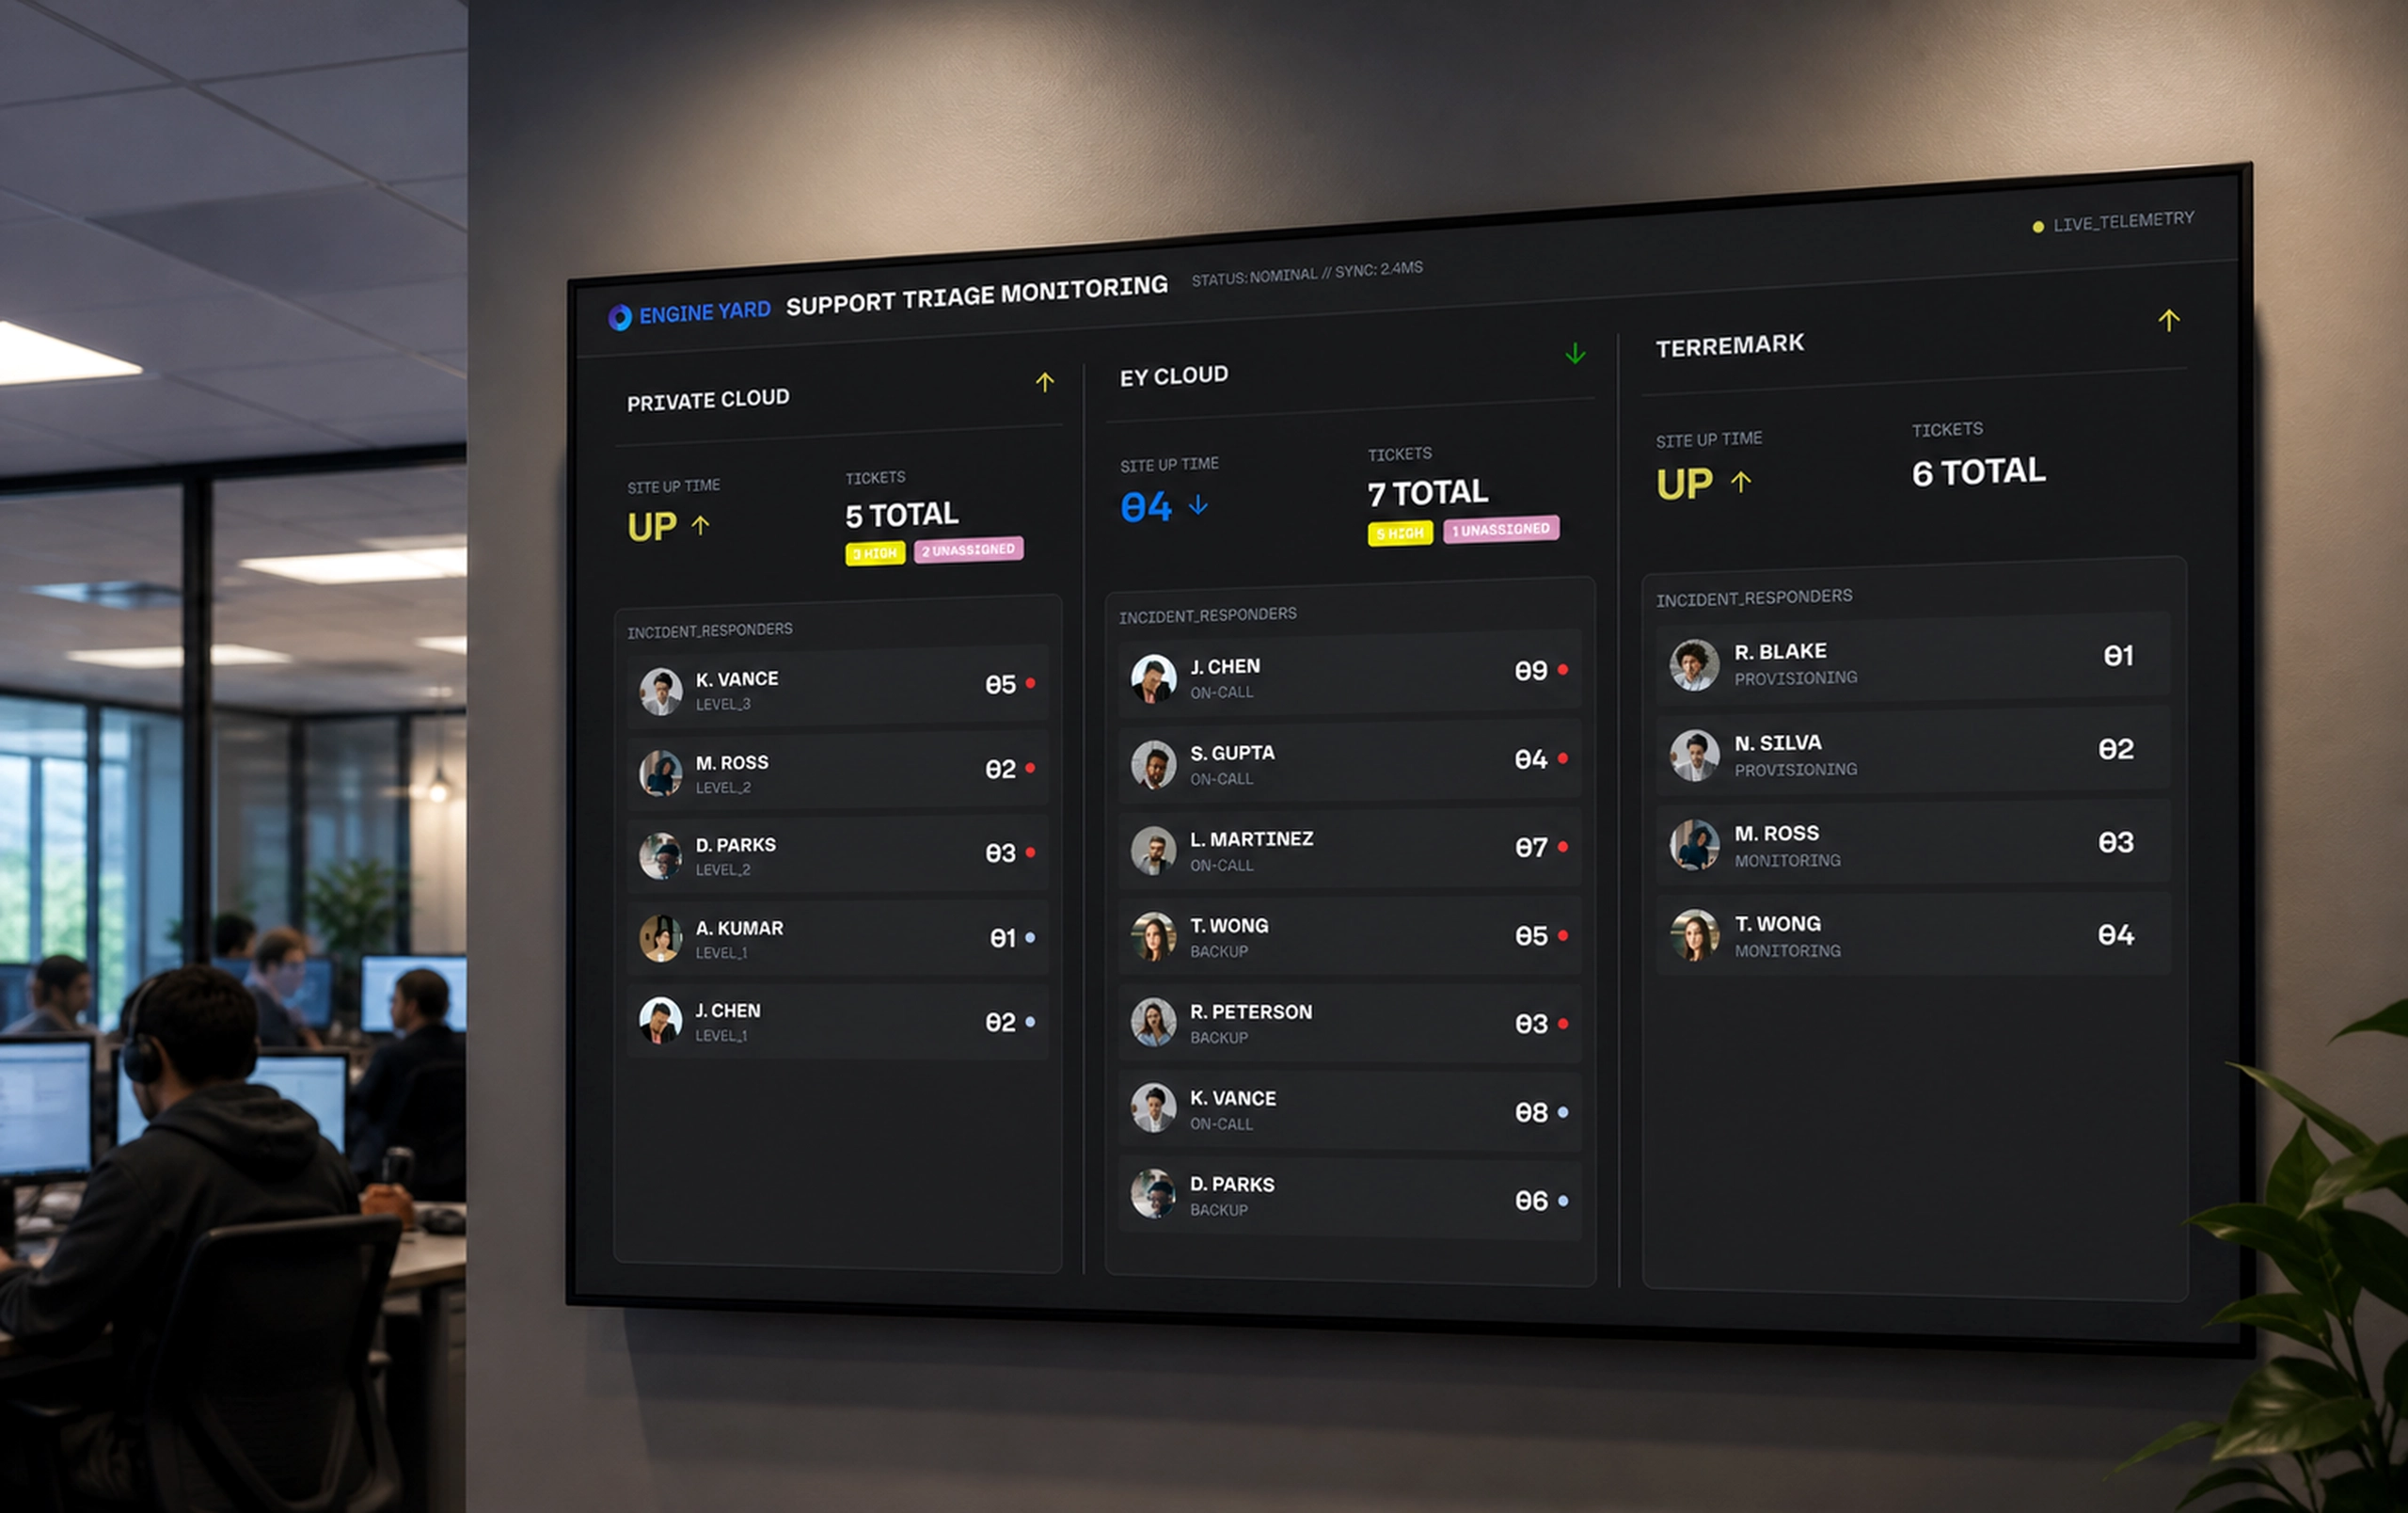
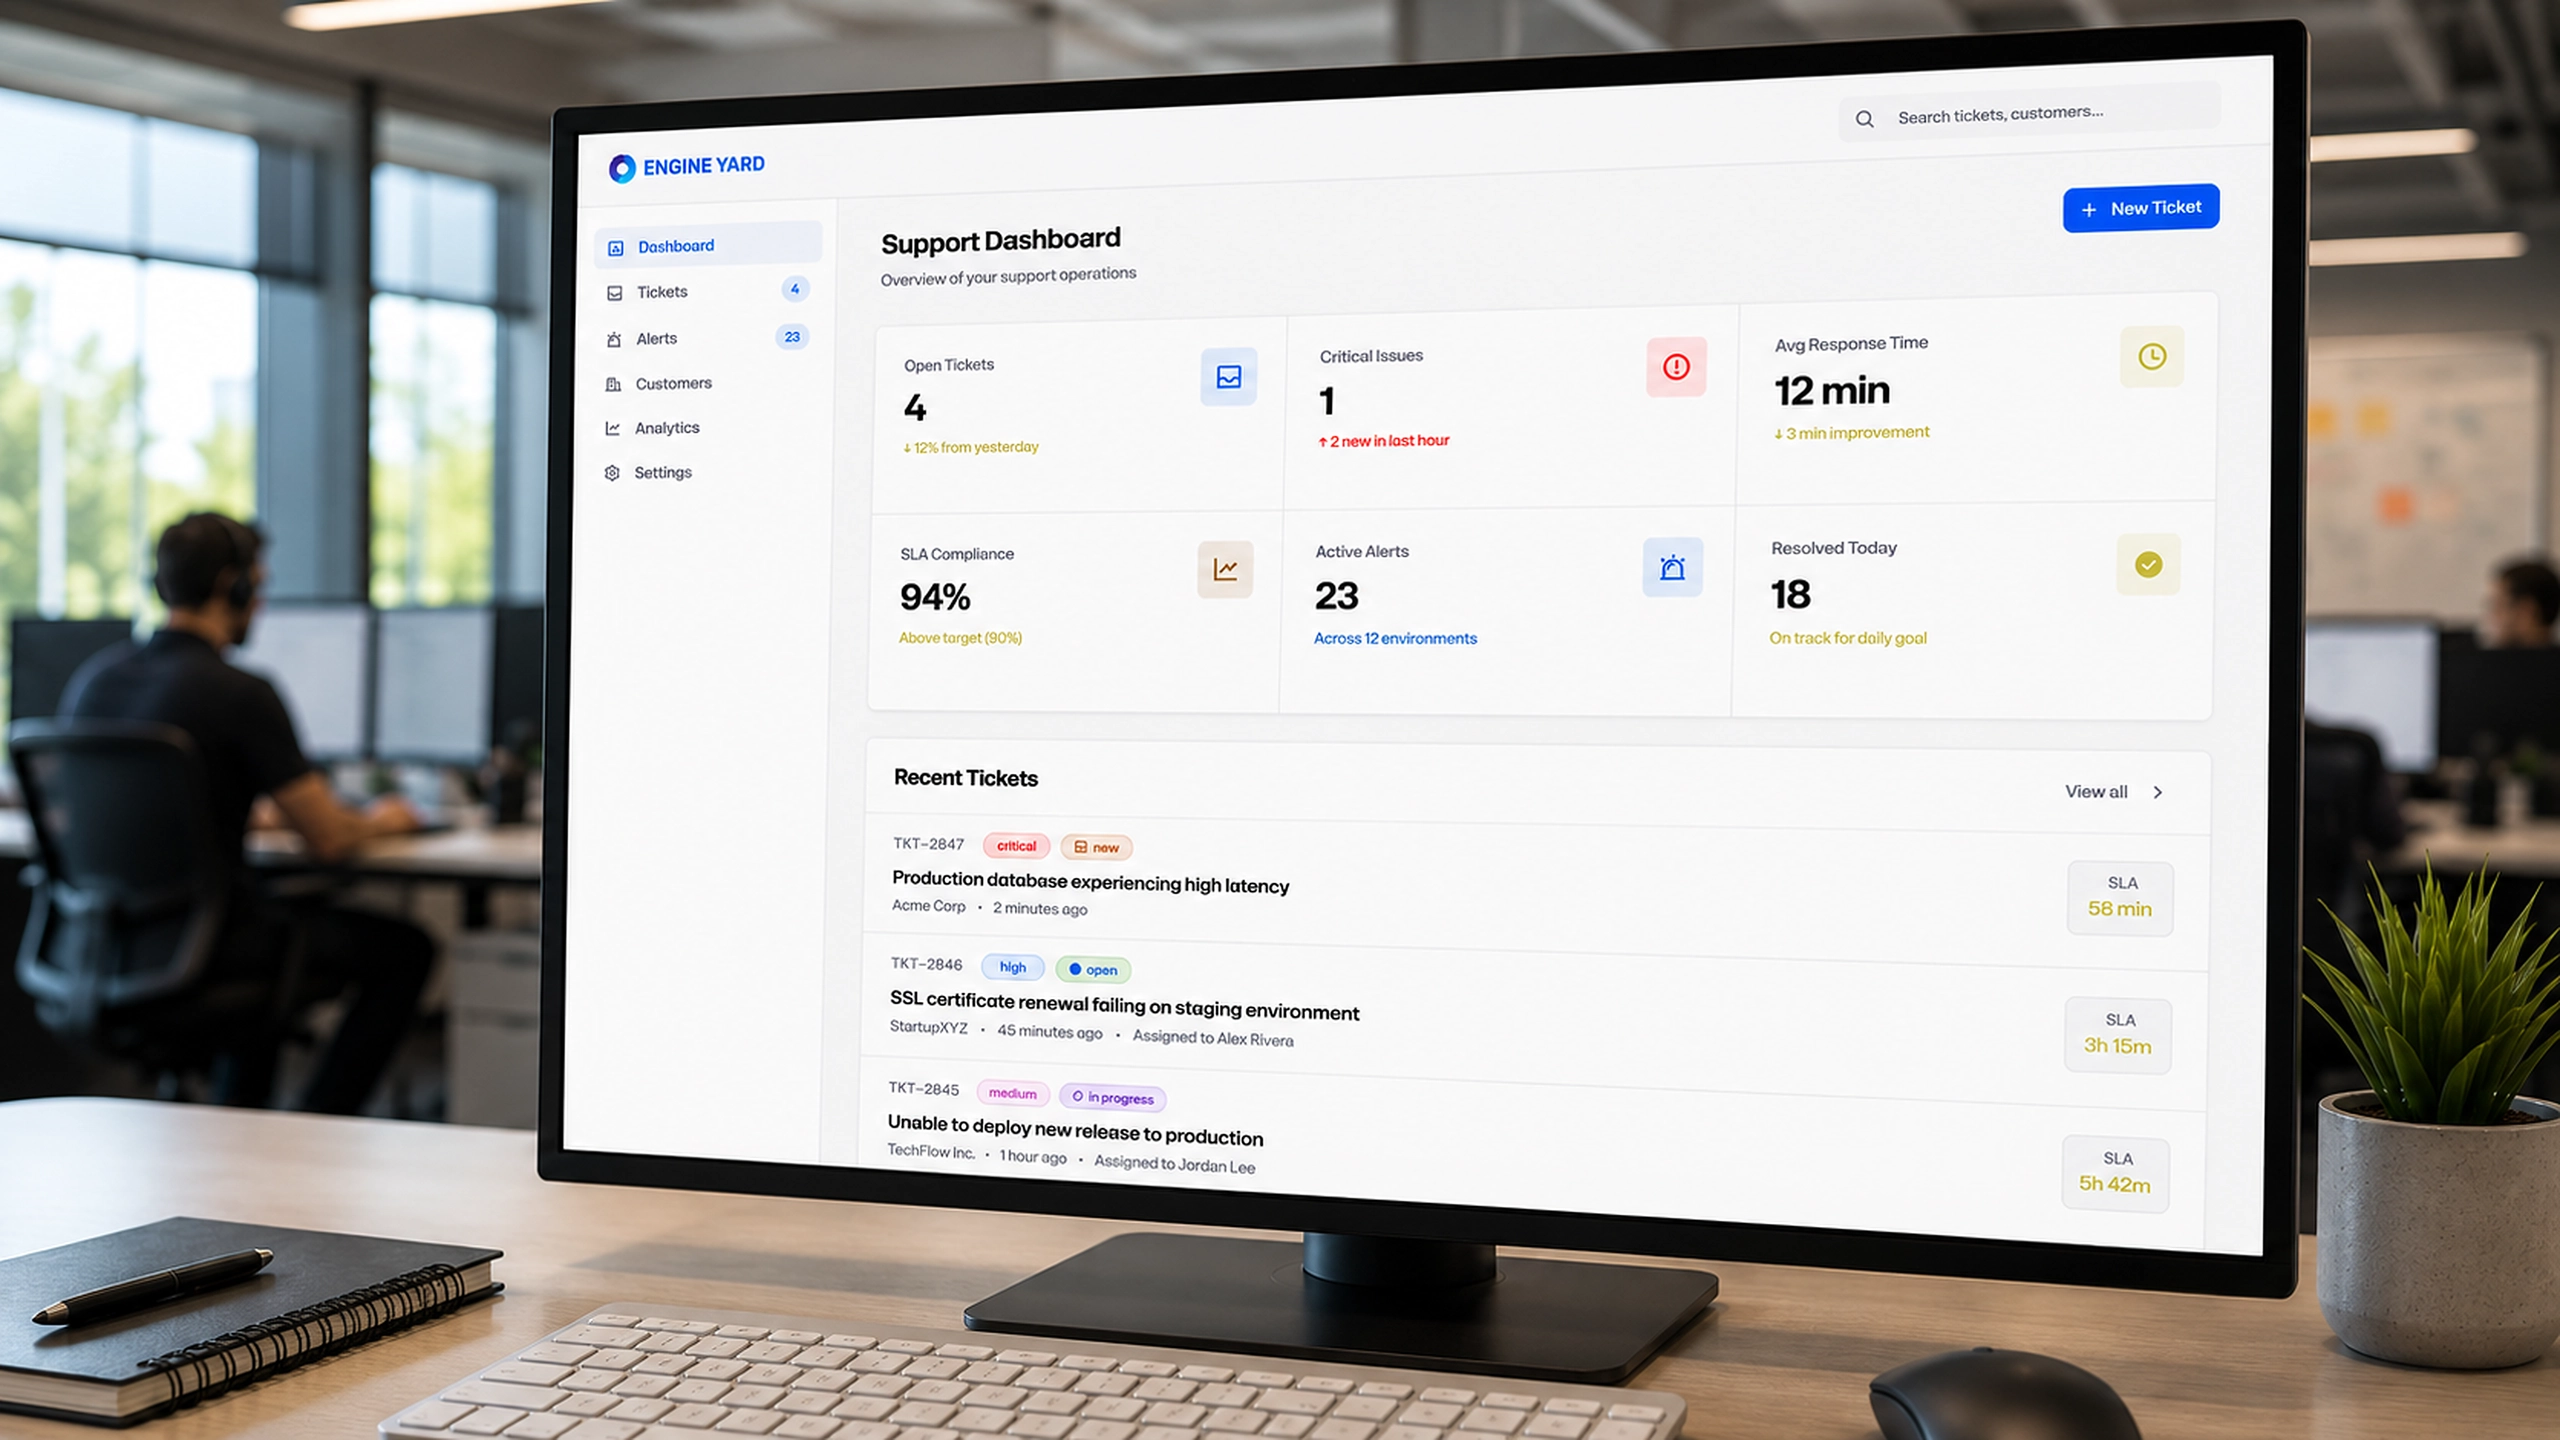
Support Monitoring Dashboard
Summary
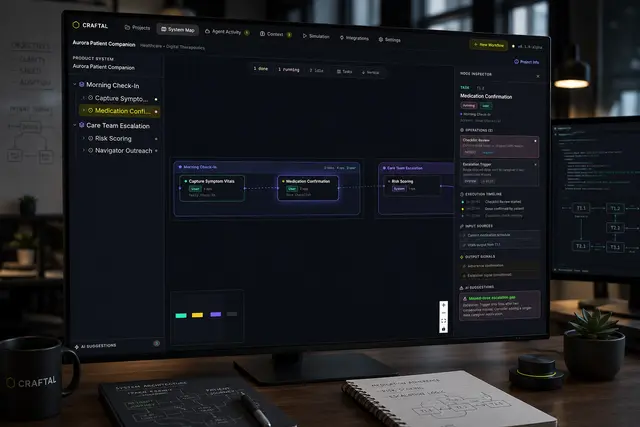
A monitoring dashboard that provided support teams with continuous visibility into platform health and support activity.
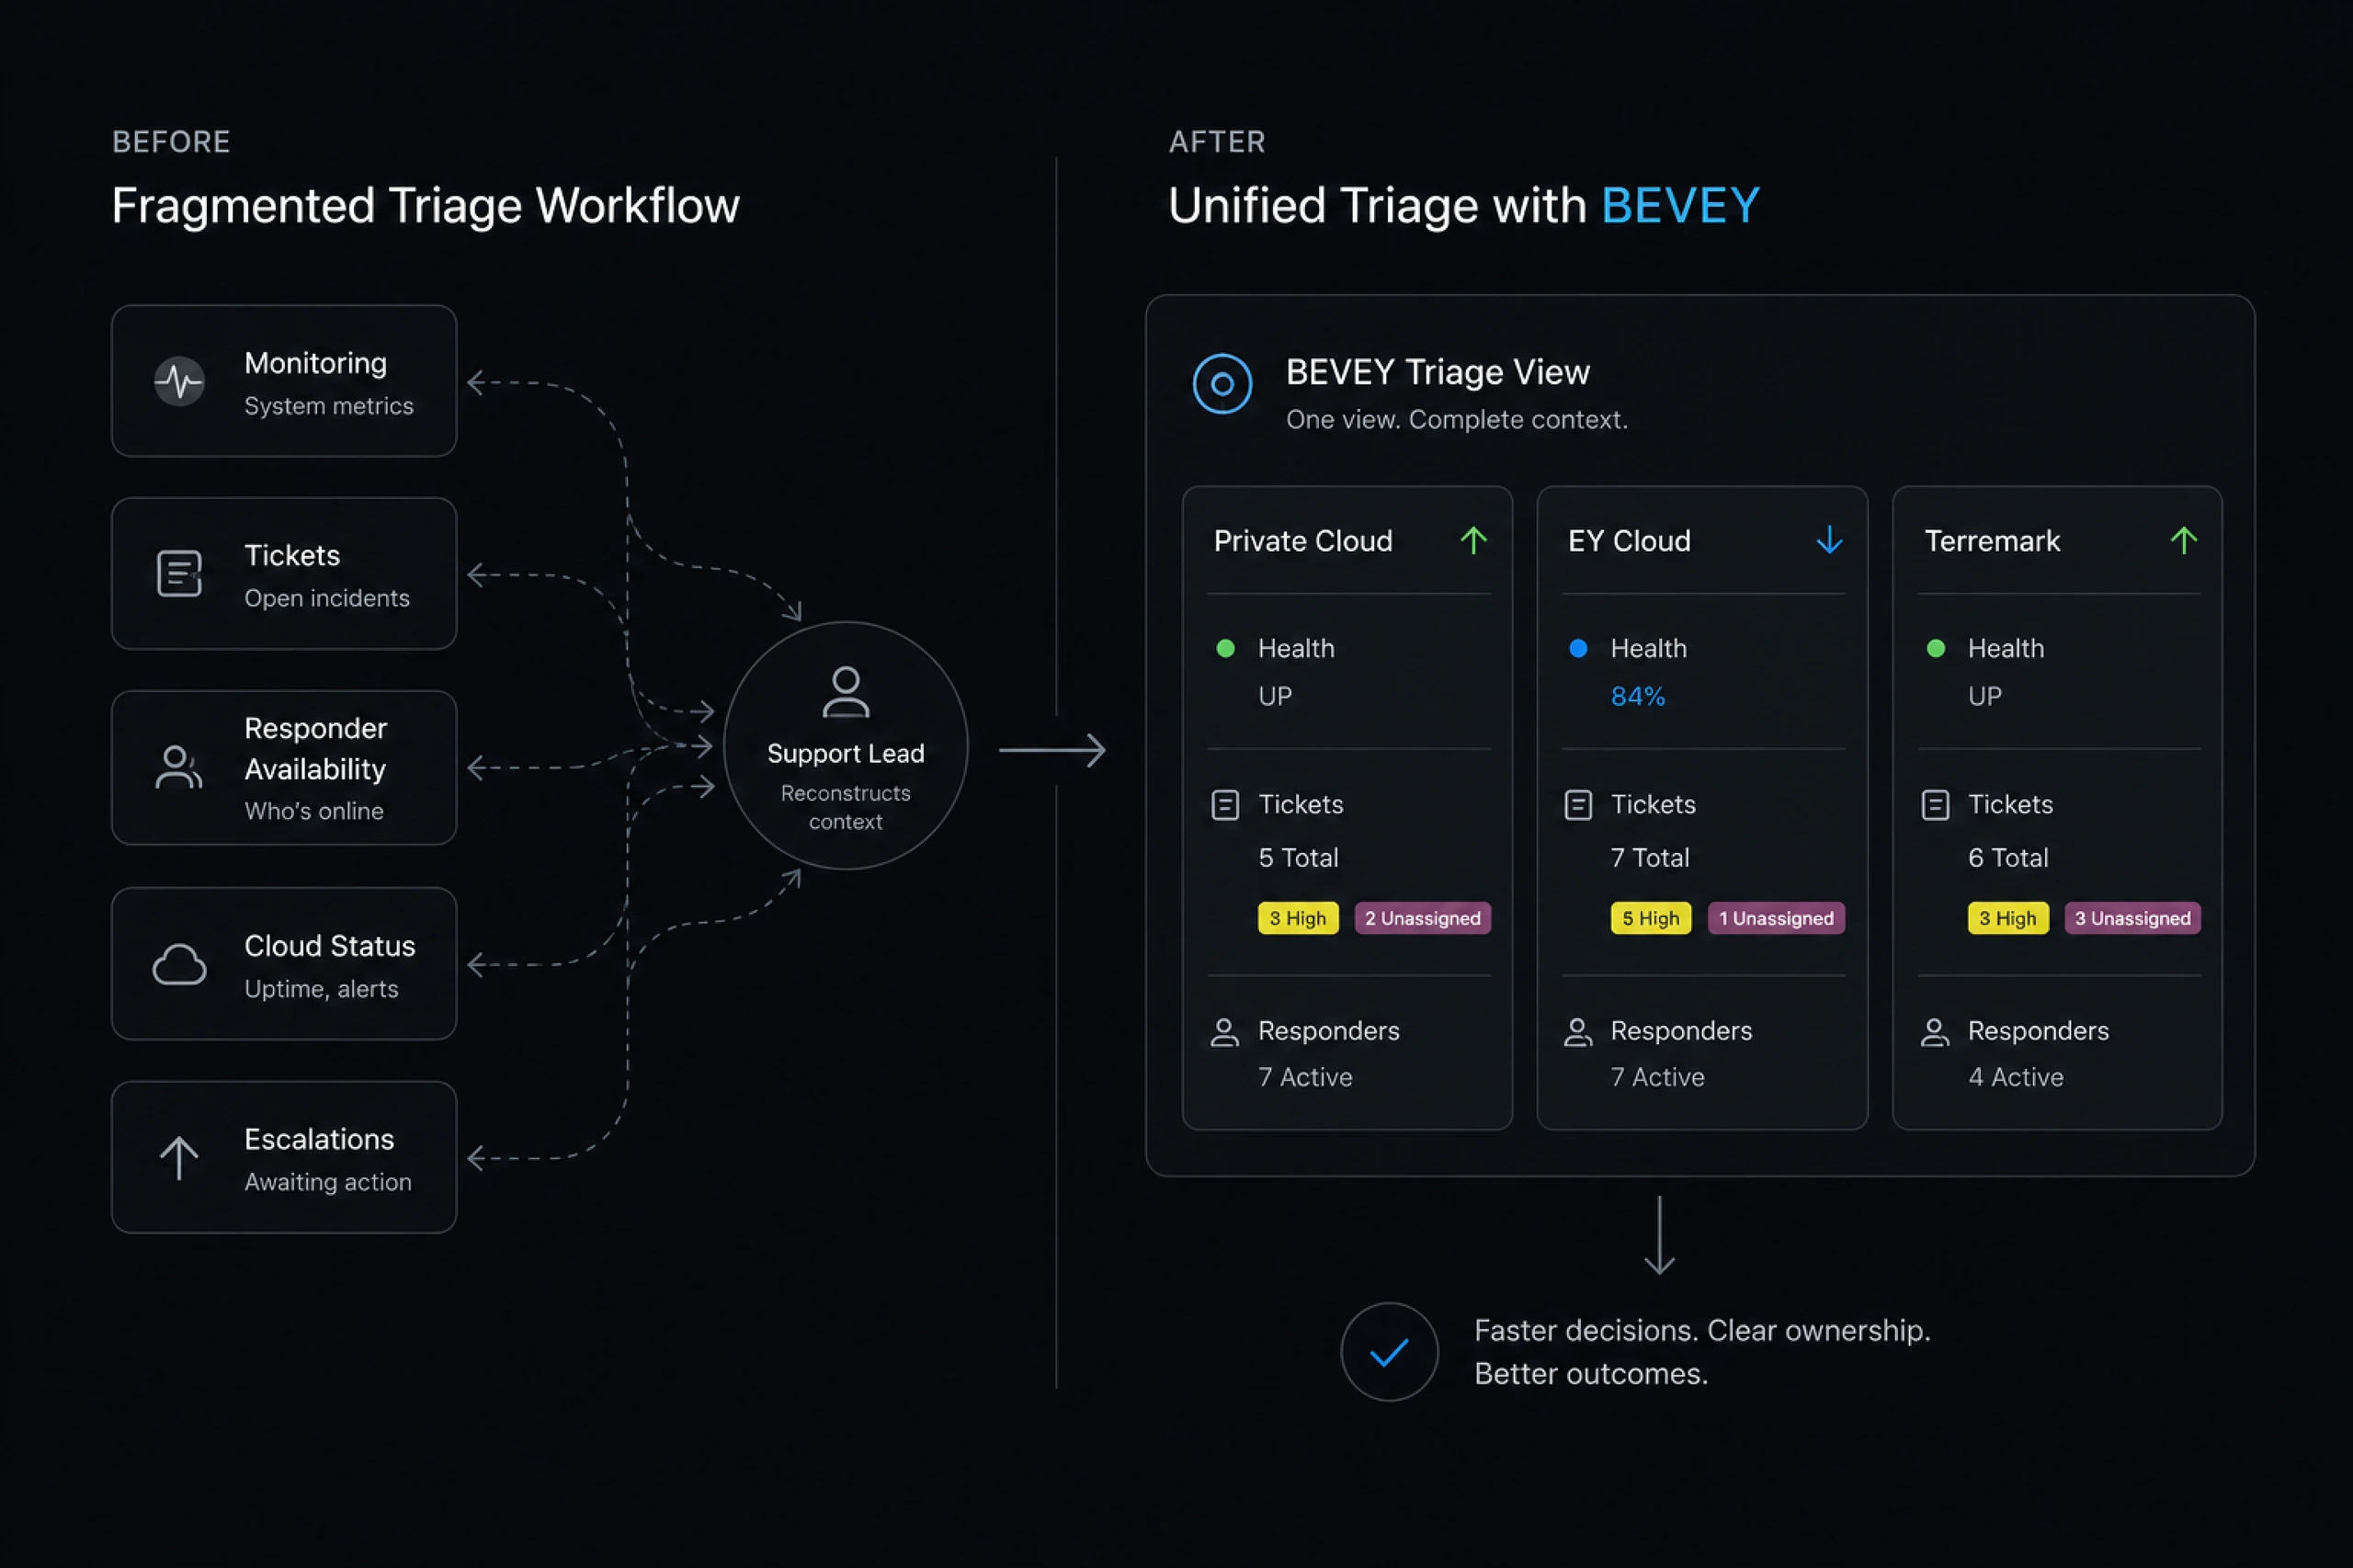
Operating a managed cloud platform required constant visibility into system health and customer incidents. Traditional ticket systems did not provide real time operational awareness for support teams managing infrastructure environments.
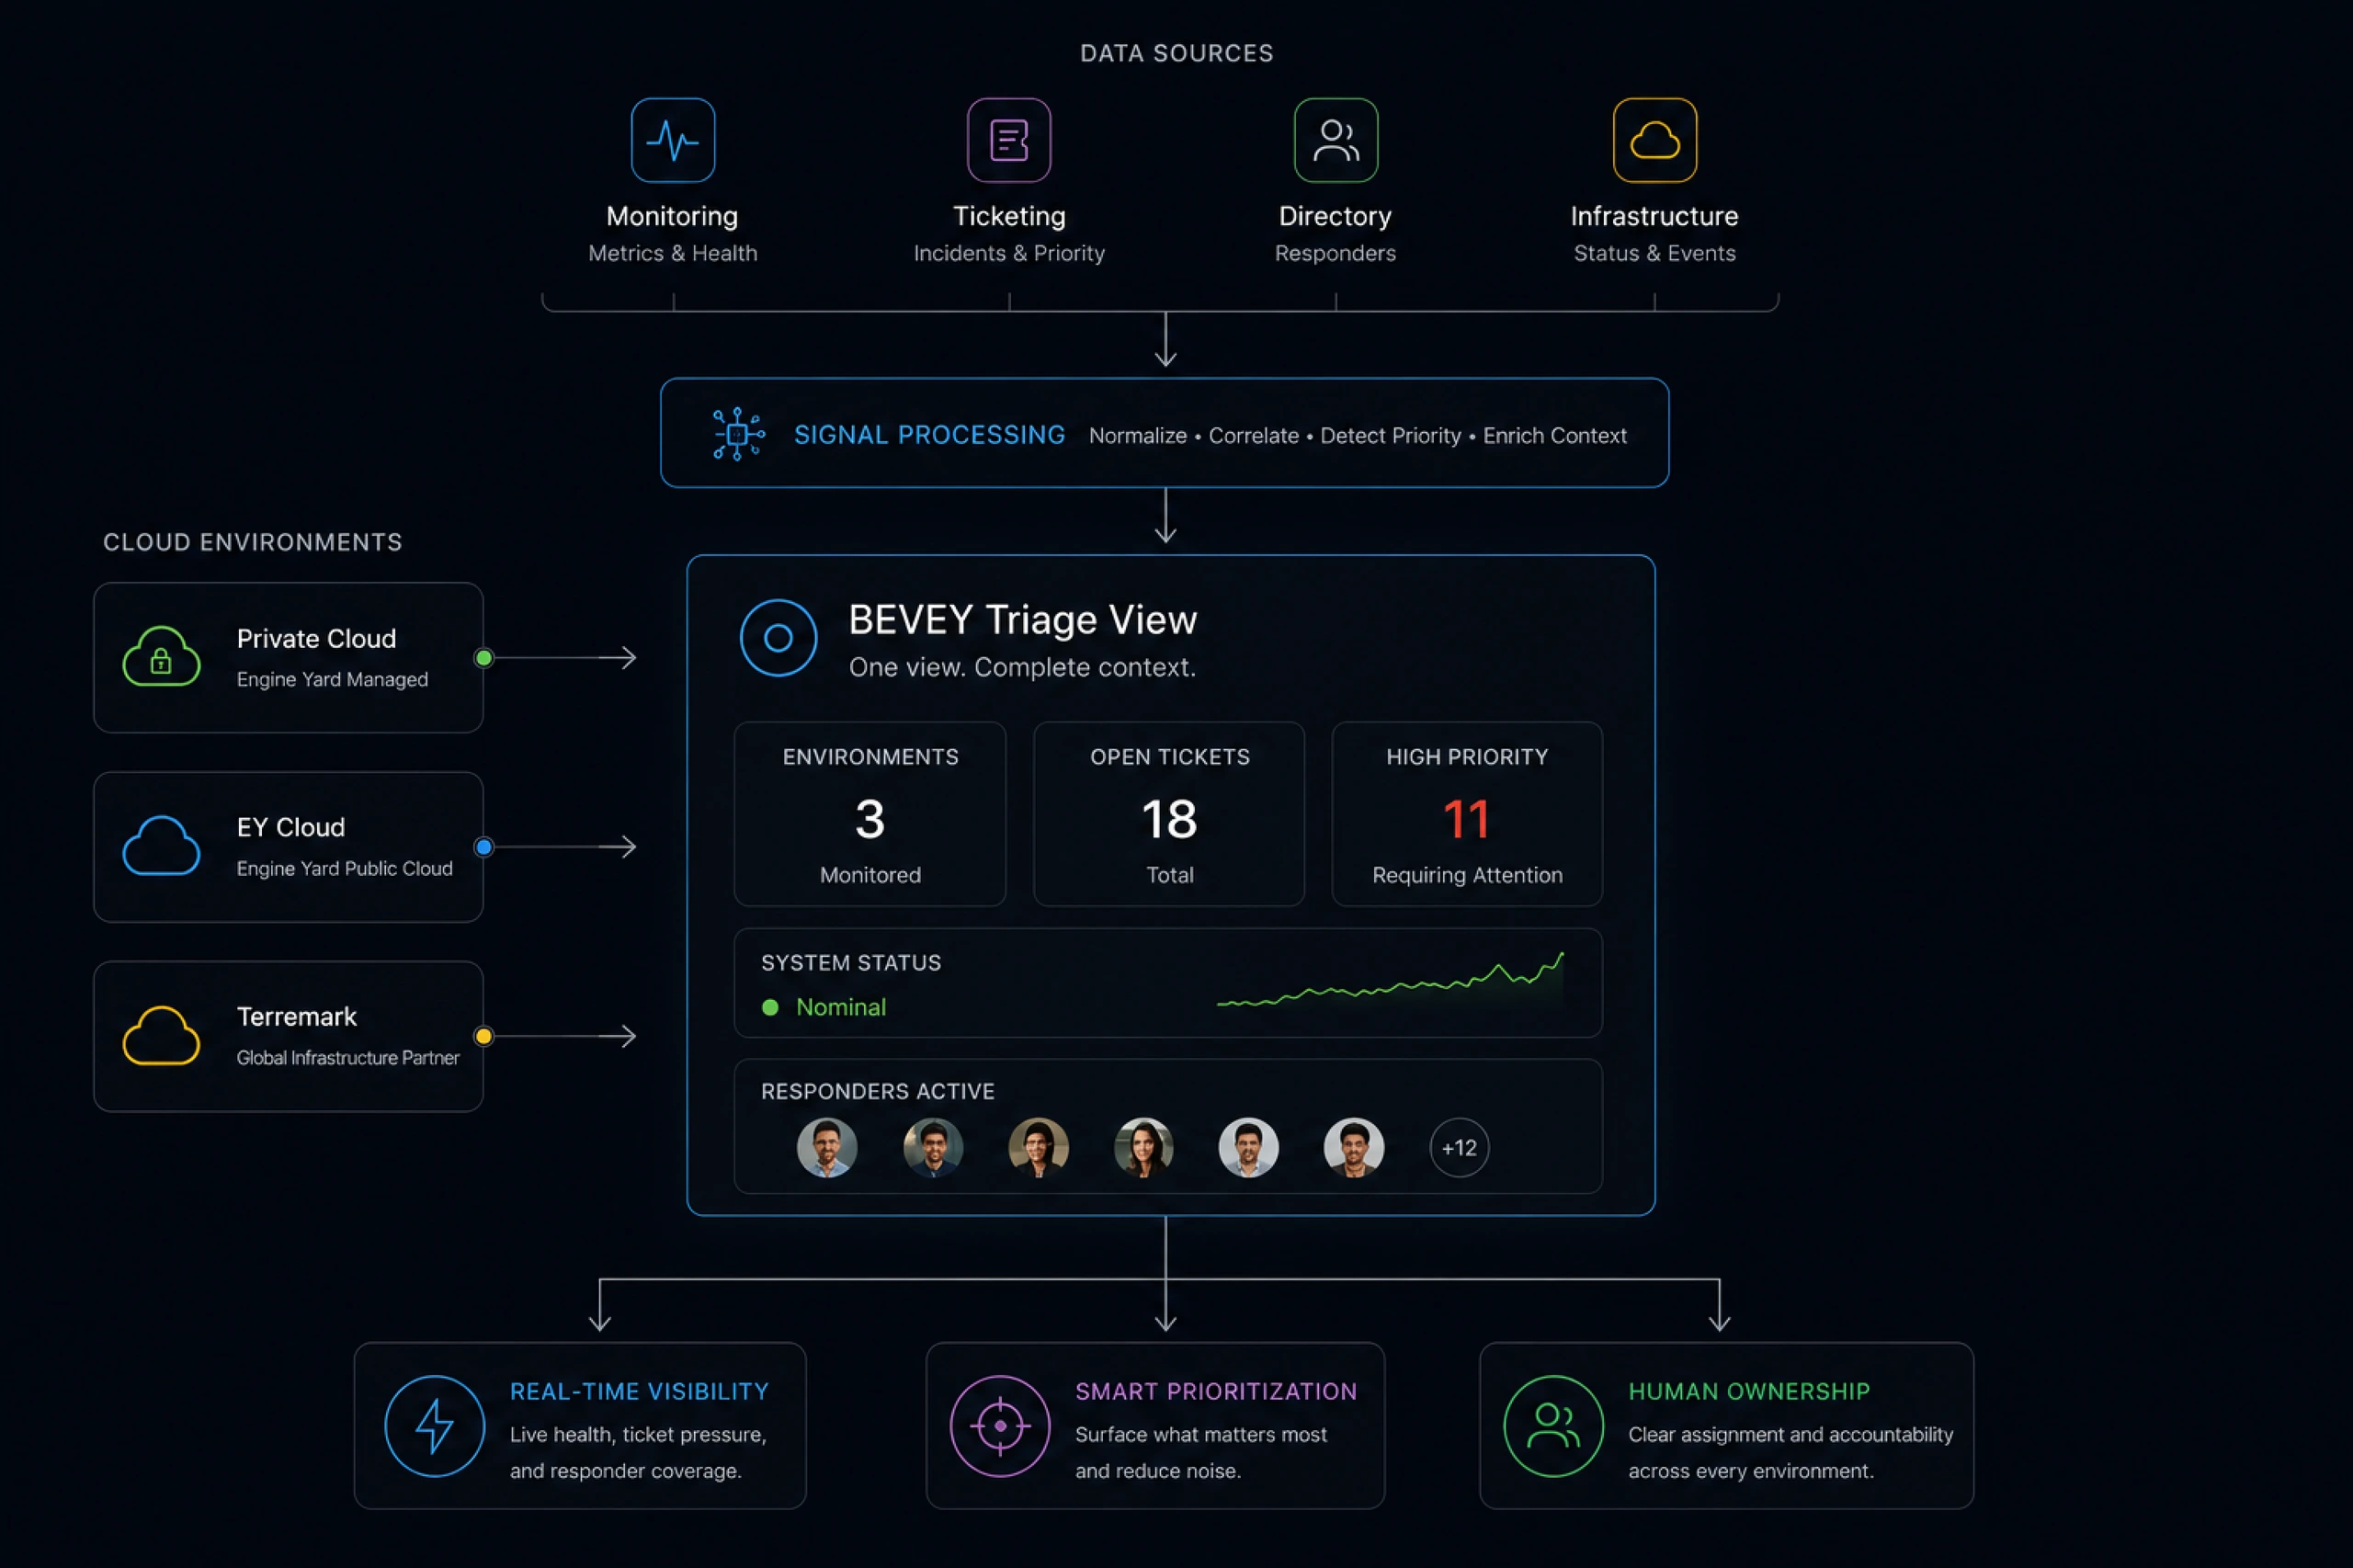
Bevey was designed as a monitoring dashboard that aggregated infrastructure signals and support activity into a single visual interface, allowing operations teams to quickly detect outages, identify high priority incidents, and coordinate responses.
Outcome
Faster shared awareness during cloud support triage
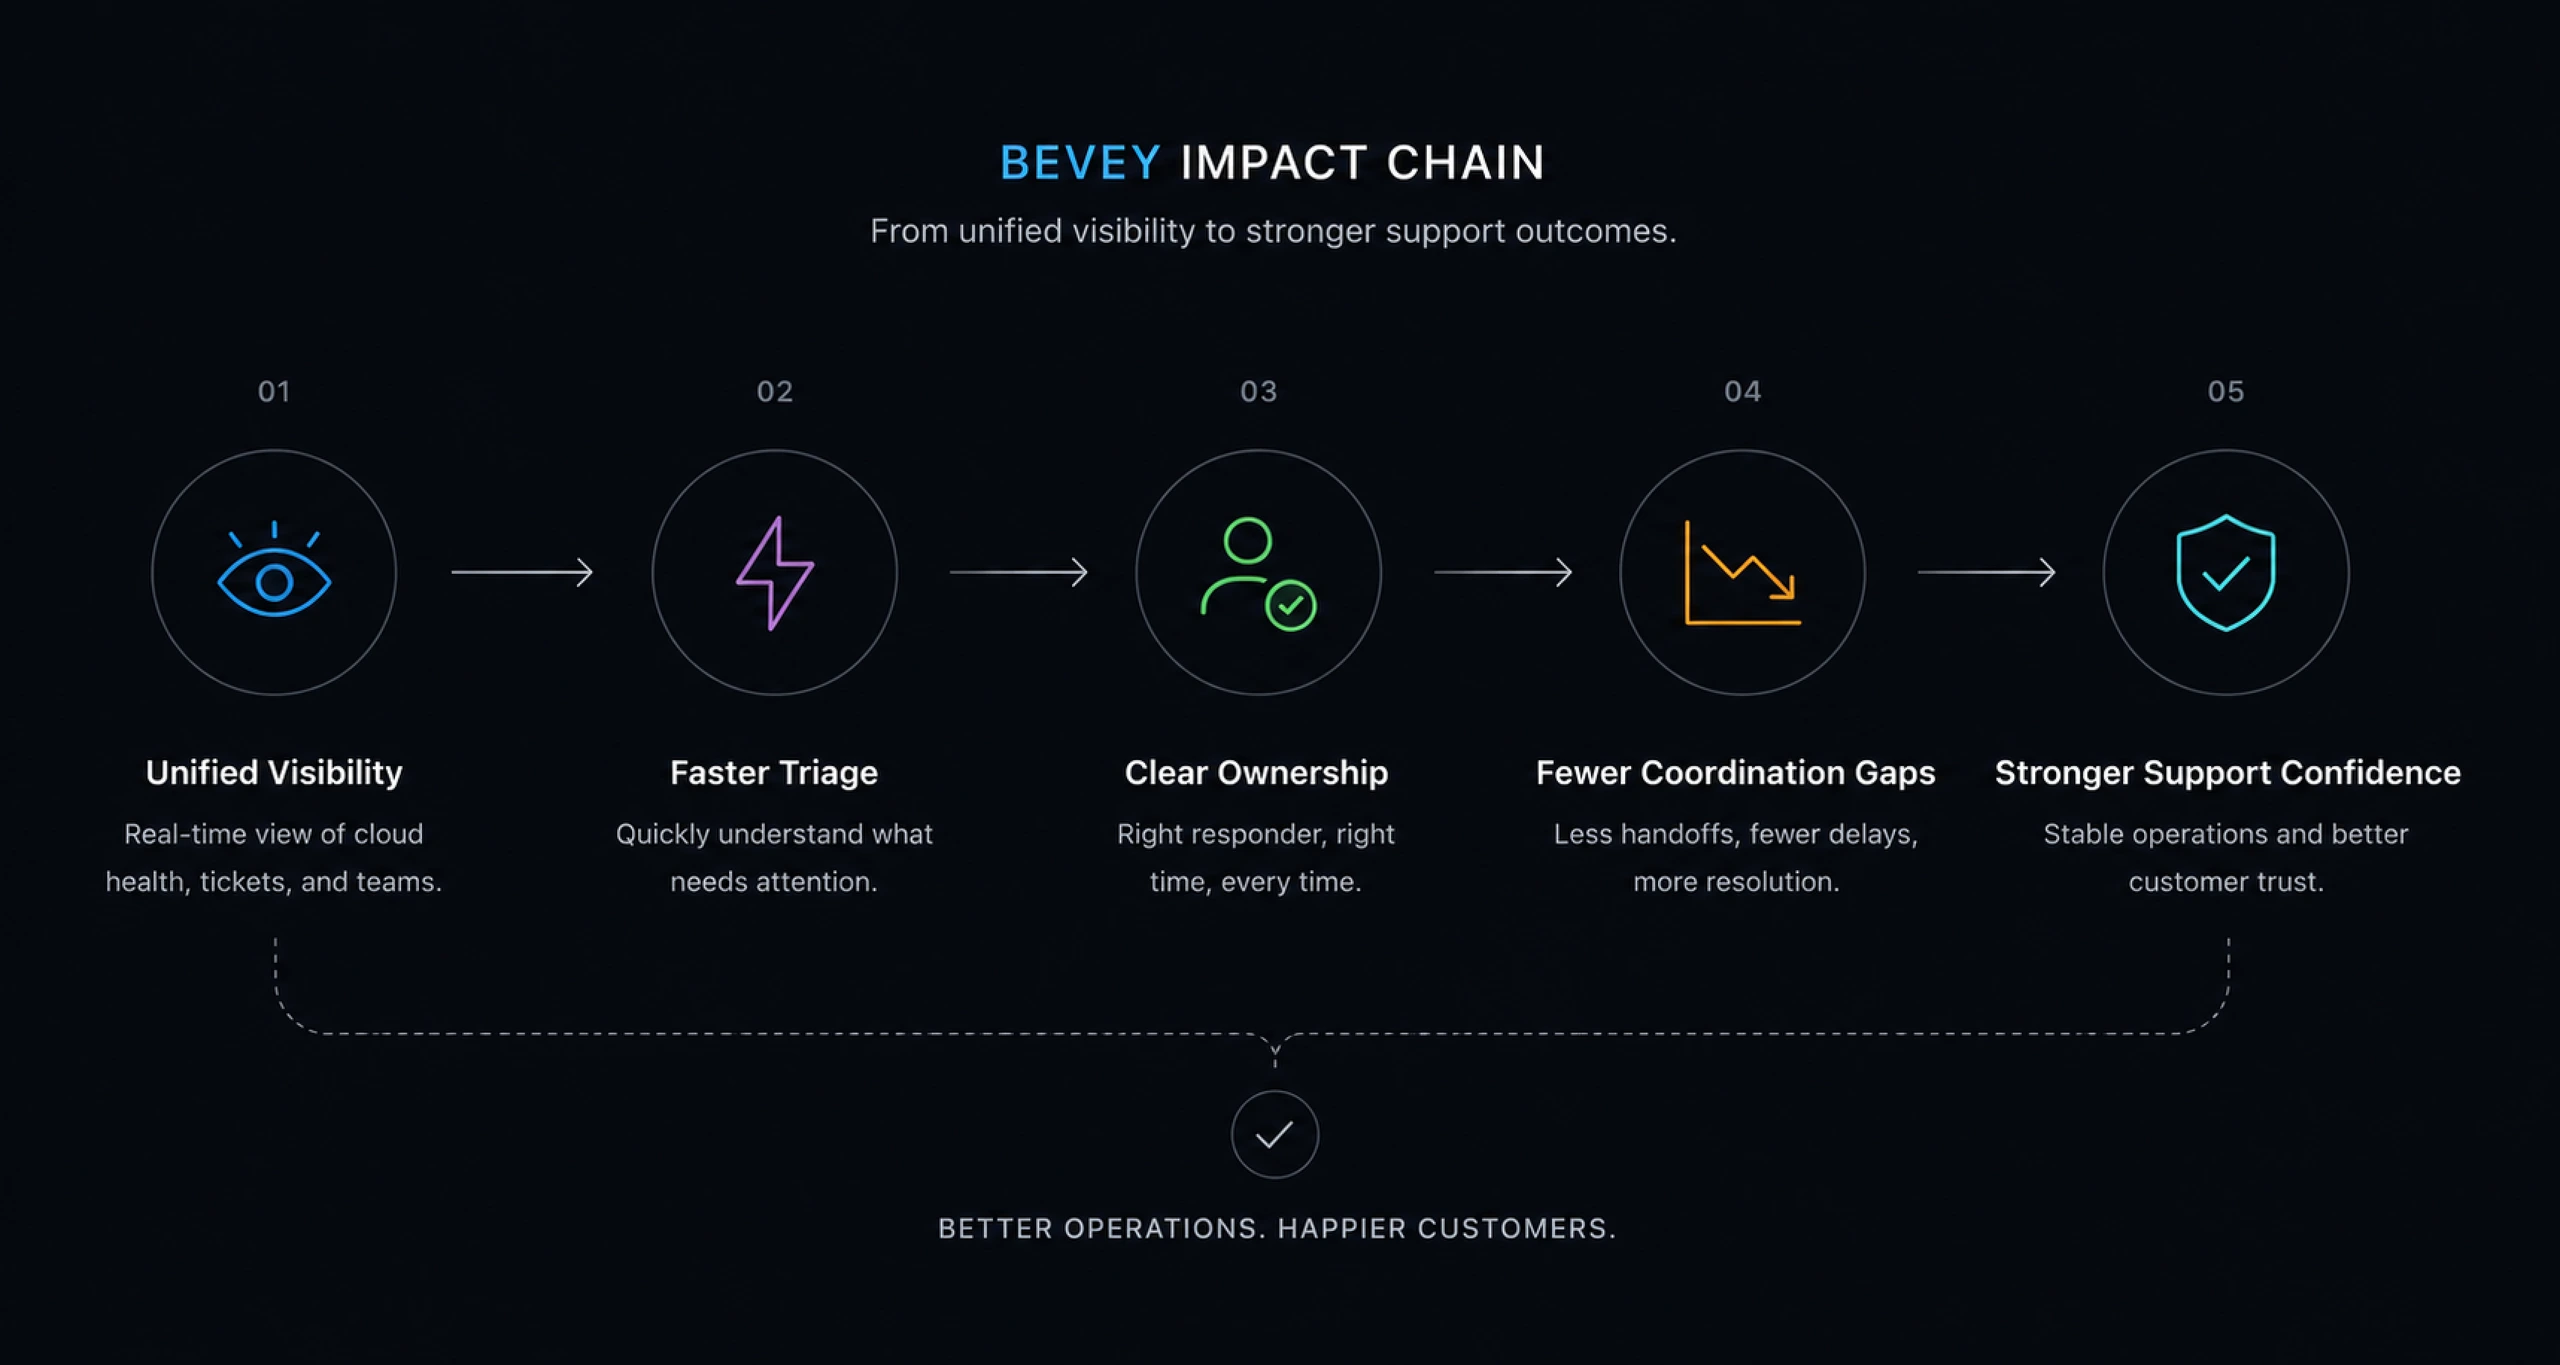
BEVEY gave support teams a clearer way to understand live platform health and responder coverage. The value of the design was practical: fewer moments of “who is handling this?”, less scanning across disconnected systems, and a more confident shared view of operational status.
[ Placeholder for diagram description: An impact chain diagram showing how unified visibility leads to faster triage, clearer ownership, fewer coordination gaps, and stronger customer support confidence. This should appear here because the section connects the interface decisions to business and operational outcomes. Pattern: Impact Chain. ]
The strongest outcomes were likely qualitative rather than formally measured:
- Faster awareness of cloud environment health.
- Clearer assignment visibility across responders.
- Better distinction between normal activity and high-priority ticket pressure.
- More confidence for support leads monitoring multiple environments.
- A calmer operational surface for high-stakes support work.
This project fits a larger pattern in my work: designing interfaces that make complex systems easier to operate without pretending the complexity is gone. BEVEY was about turning live infrastructure signals into a usable command surface, giving technical teams enough clarity to act quickly and enough context to trust what they were seeing.
The Problem
Support teams needed signal, not another wall of data
Cloud support work is stressful because the important details are scattered, time-sensitive, and easy to miss. A support team needs to know which environments are healthy, which ones are drifting into trouble, how many tickets are open, and who is actively responding. If that information lives in separate tools, the team loses precious time building the picture before they can act.
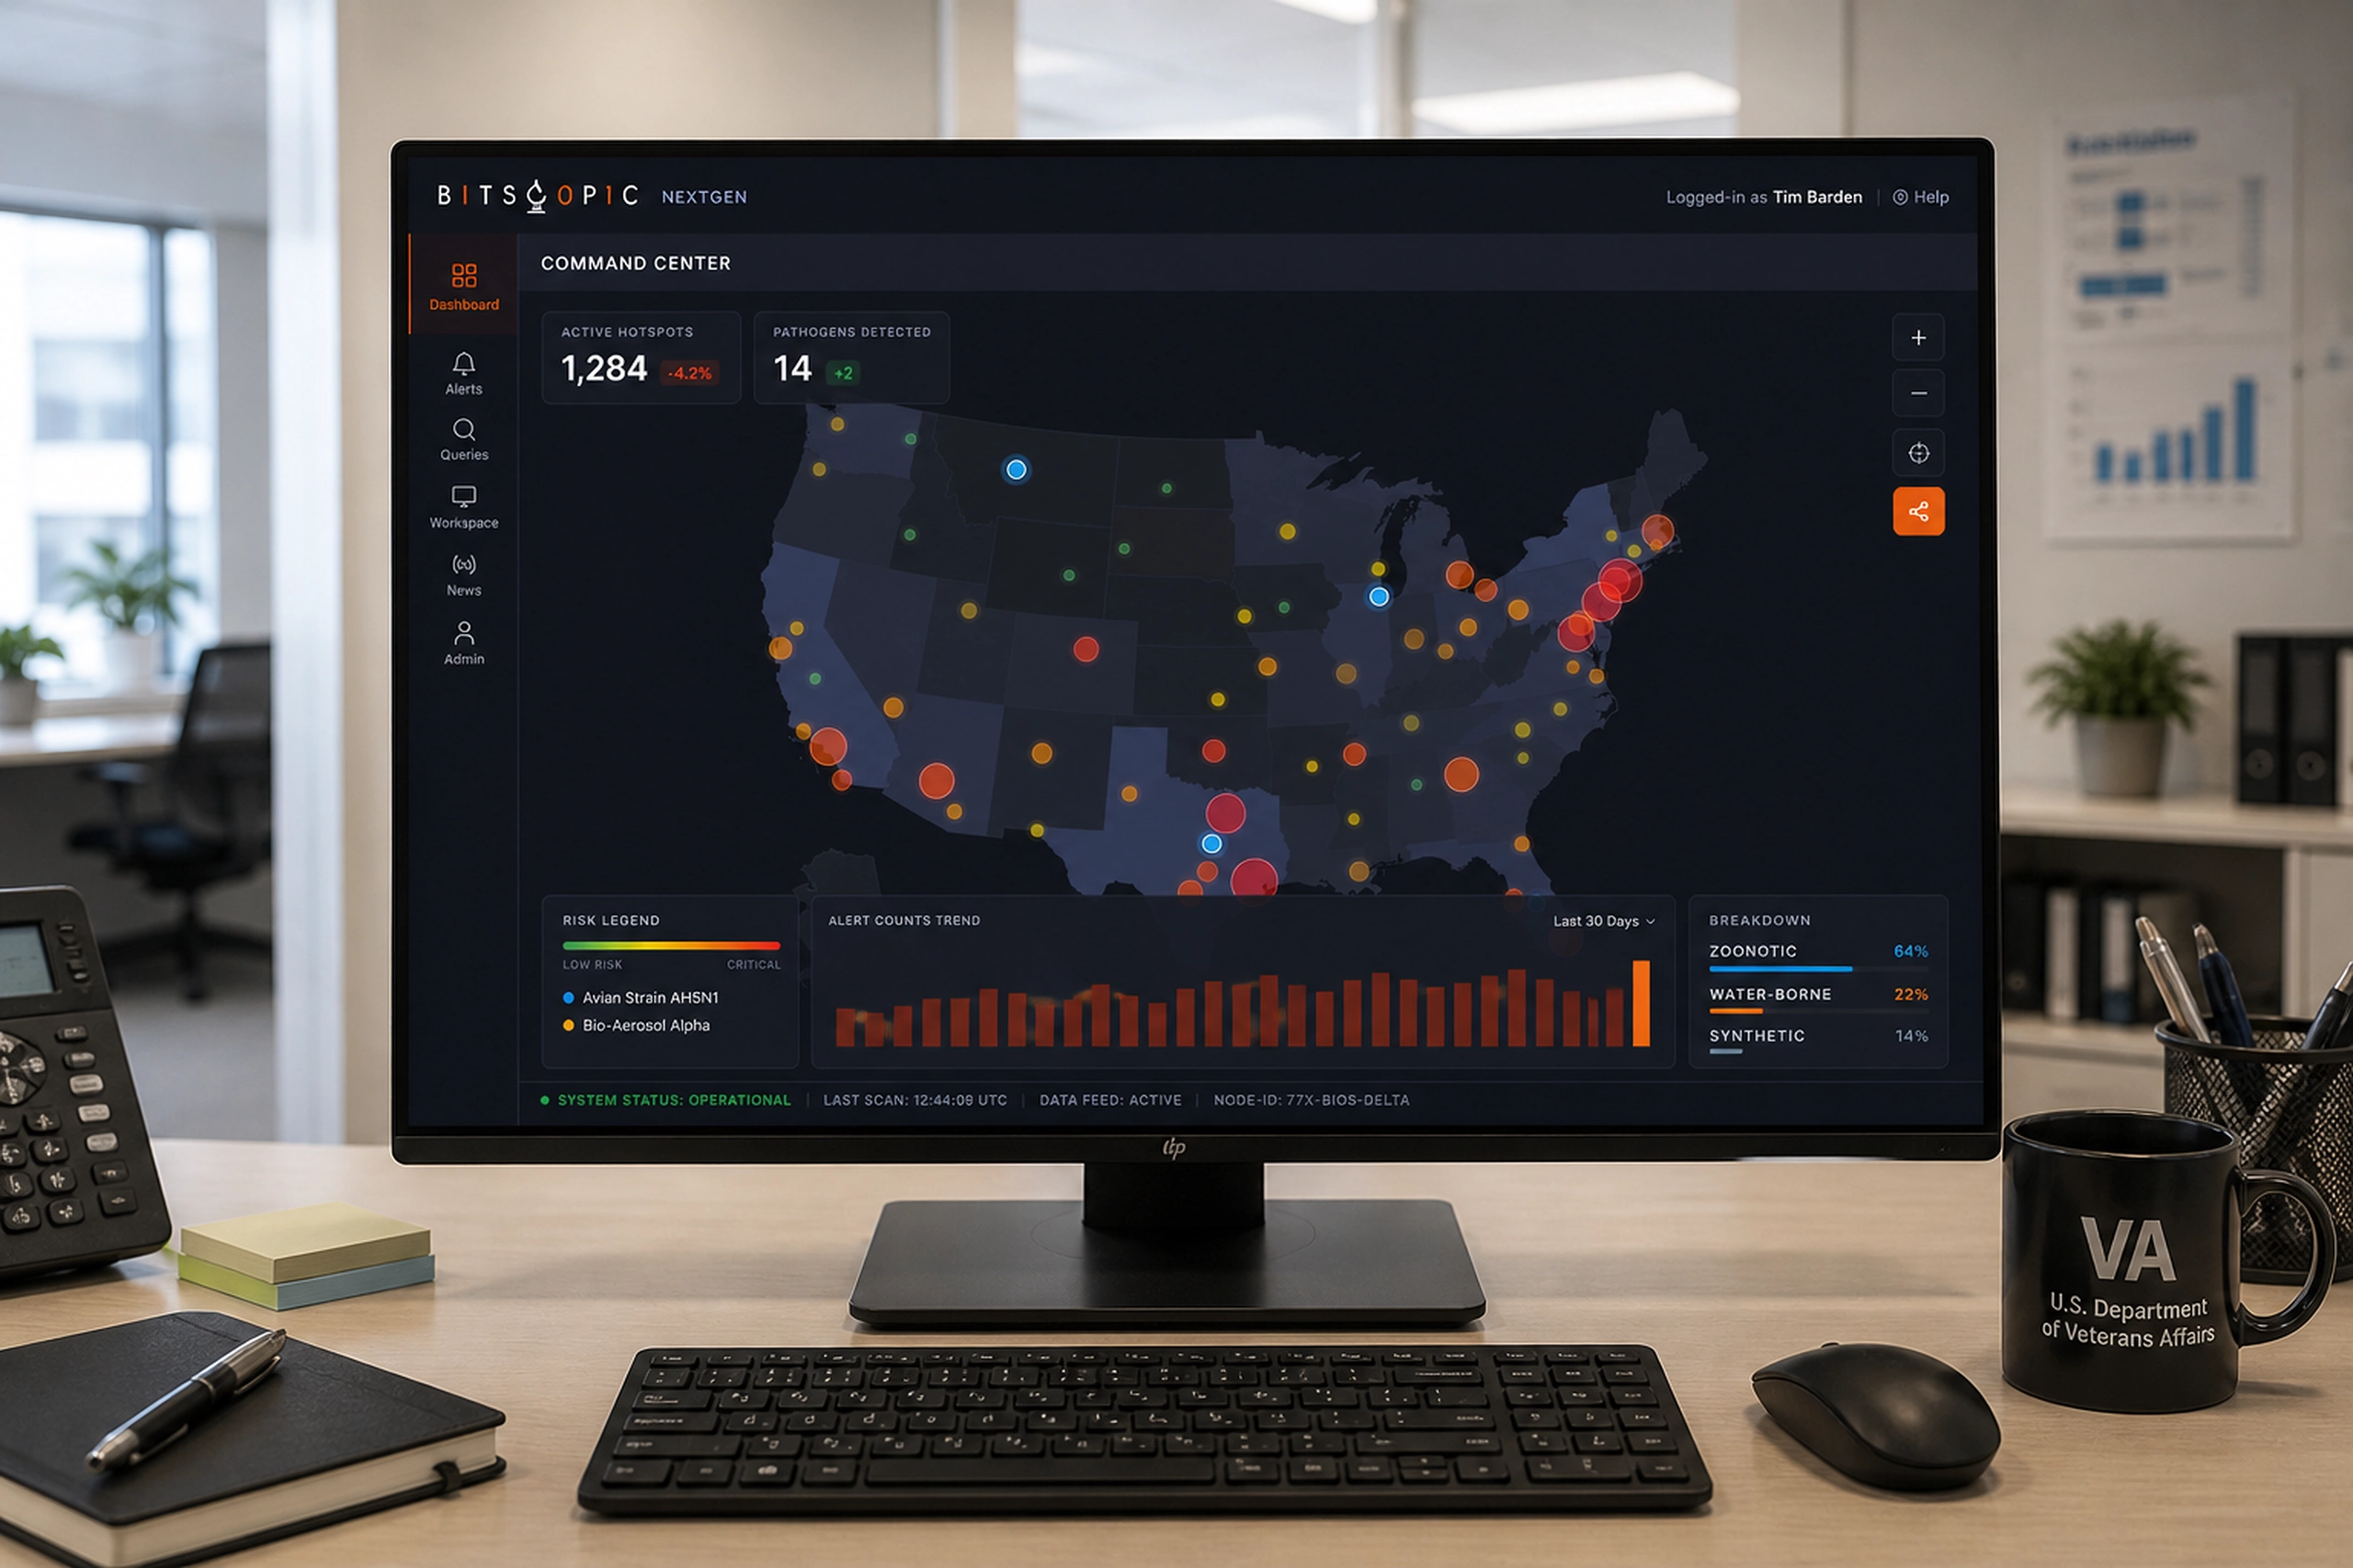
BEVEY’s interface suggests a high-pressure monitoring context: three infrastructure environments, live telemetry, uptime state, ticket counts, ticket priority, and assigned responders. The core problem was not the absence of data. The problem was turning operational data into a shared, readable surface that a support team could scan quickly.
The risk was operational ambiguity. When a cloud environment shows degraded status or ticket volume increases, the team needs to see that change immediately. They also need to know whether the right responder is assigned. Without that clarity, small incidents can become coordination problems.
The design challenge was to make a dense operational system feel calm without hiding the urgency. The interface needed to support fast scanning, but it also needed enough structure to avoid turning live cloud status into visual noise.
Solution
A calm command surface for real-time operational judgment
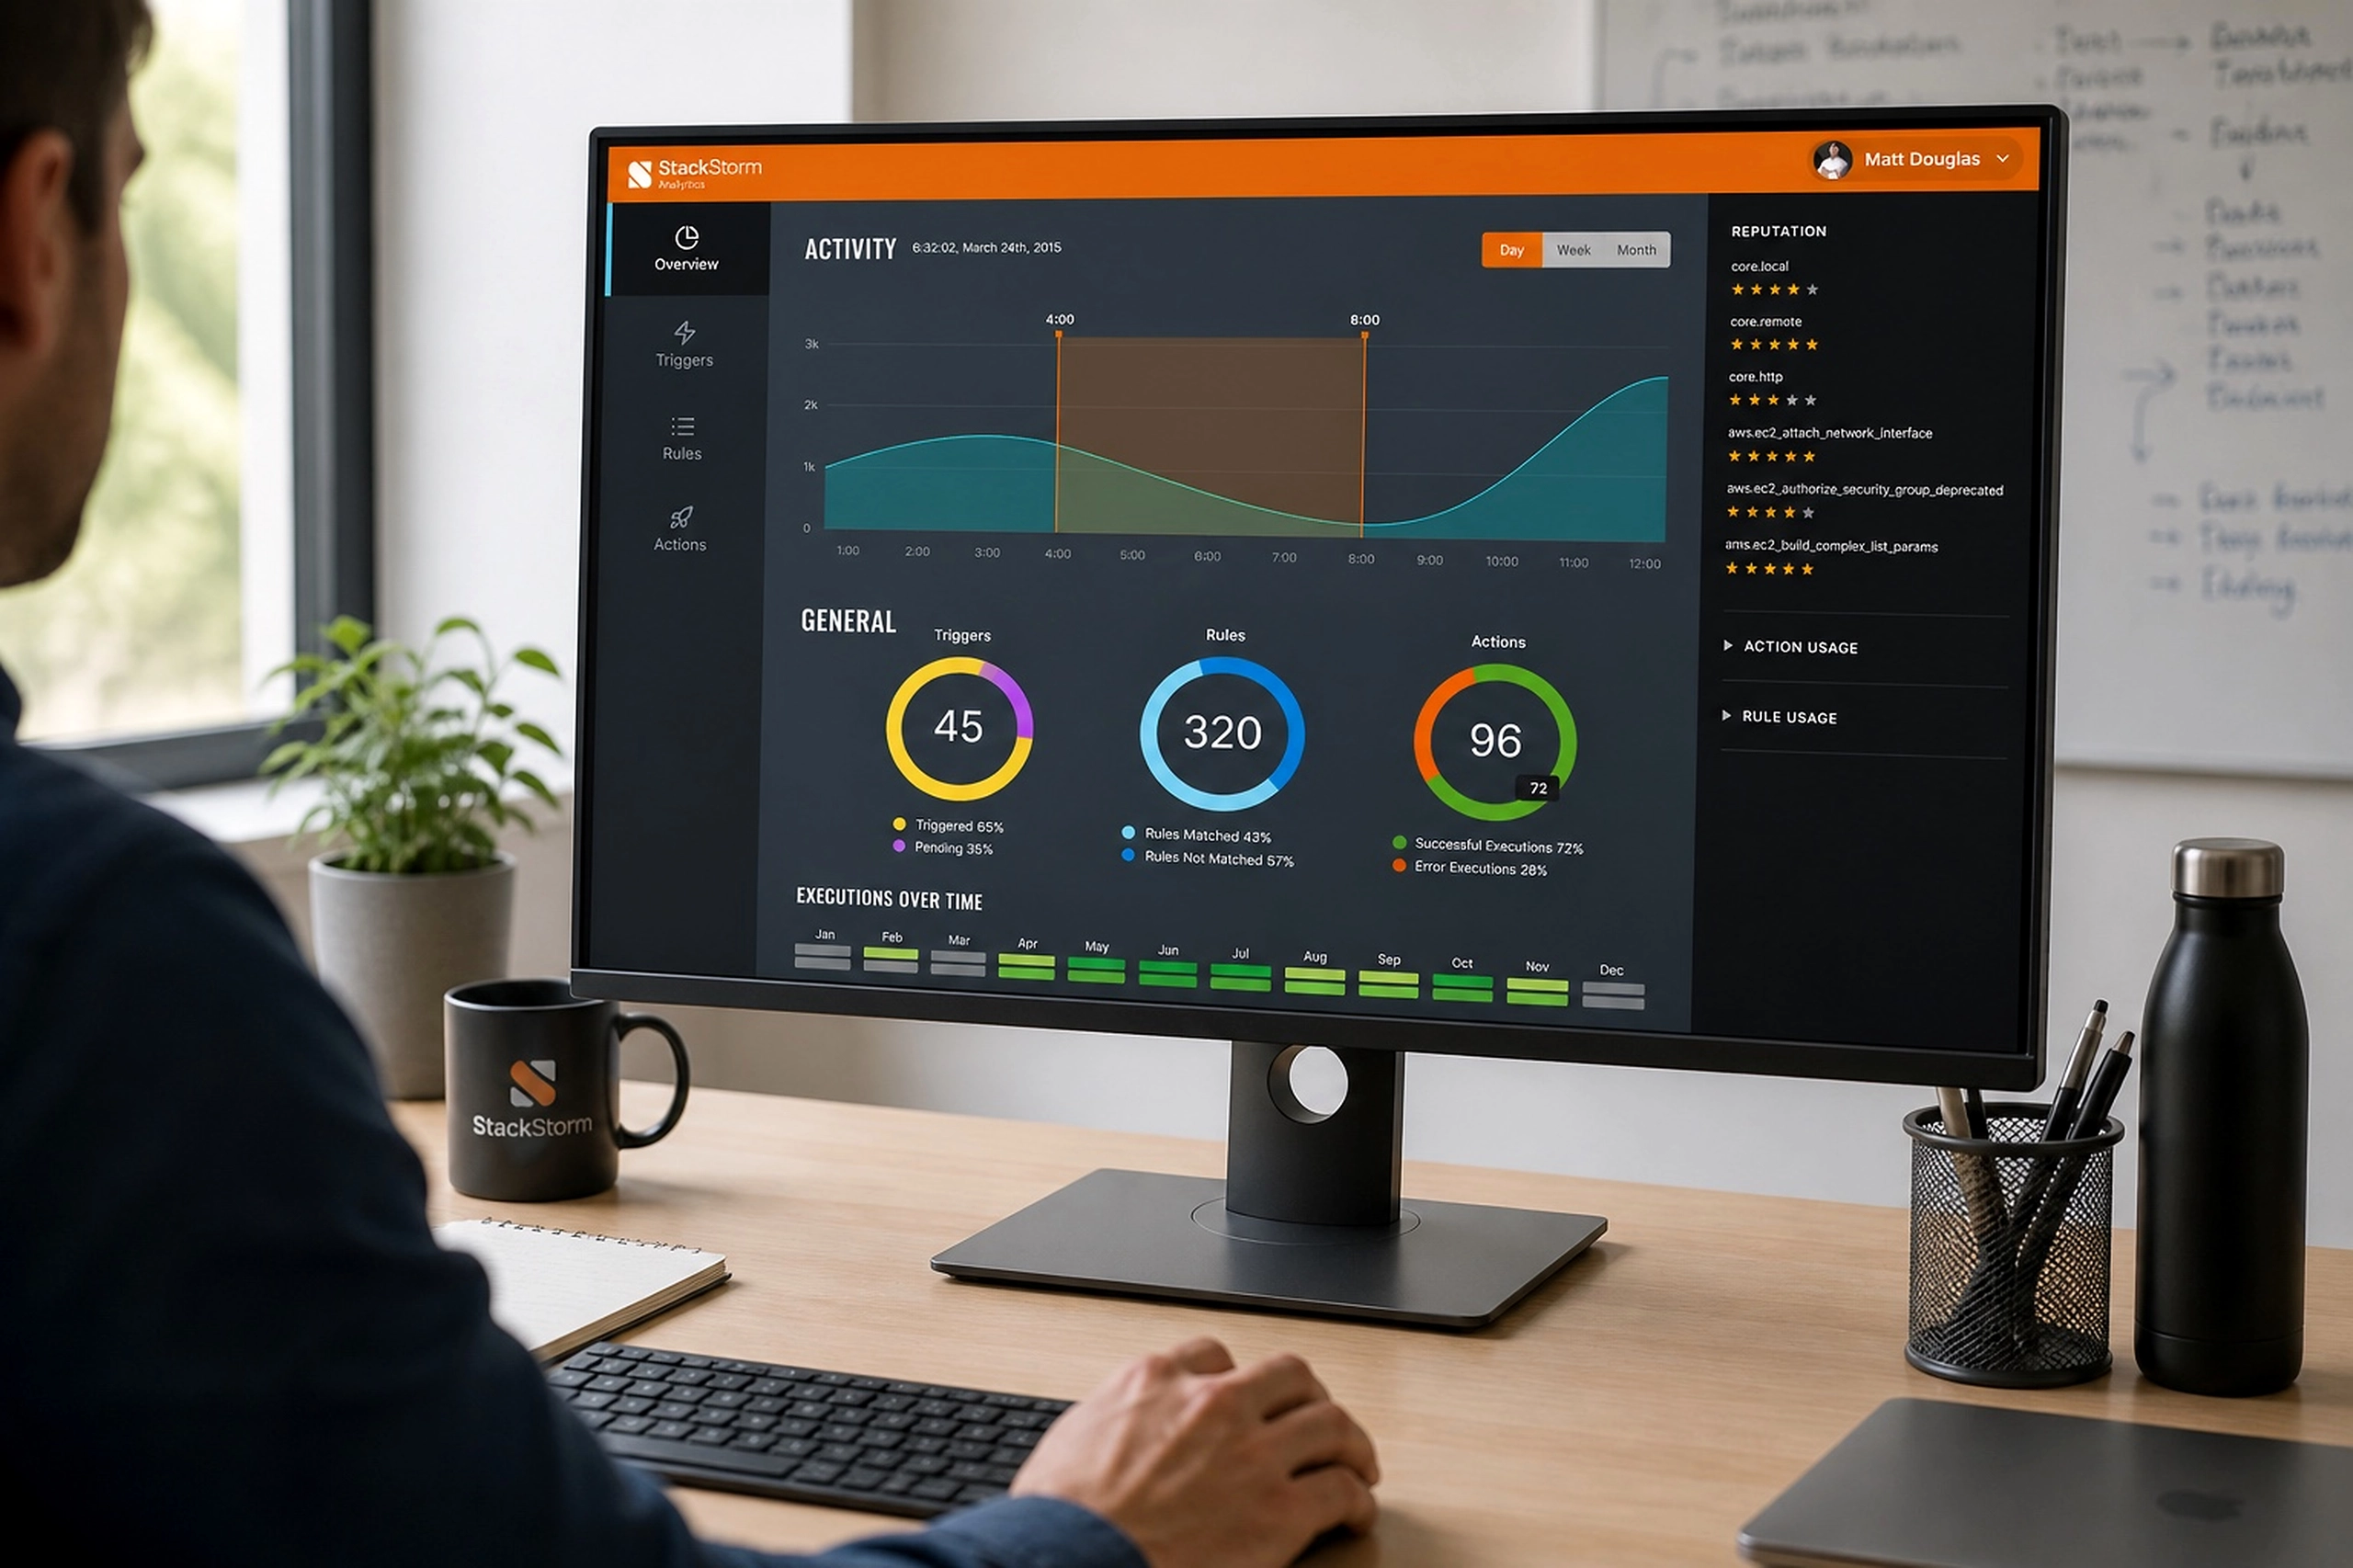
I designed BEVEY as a monitoring surface organized around the way support teams think during triage: environment first, urgency second, ownership third.
The interface separates each cloud context into its own column: Private Cloud, EY Cloud, and Terremark. That structure gives the team a clean comparison model. Instead of forcing users to interpret a generic data table, the screen lets them scan environment health side by side.
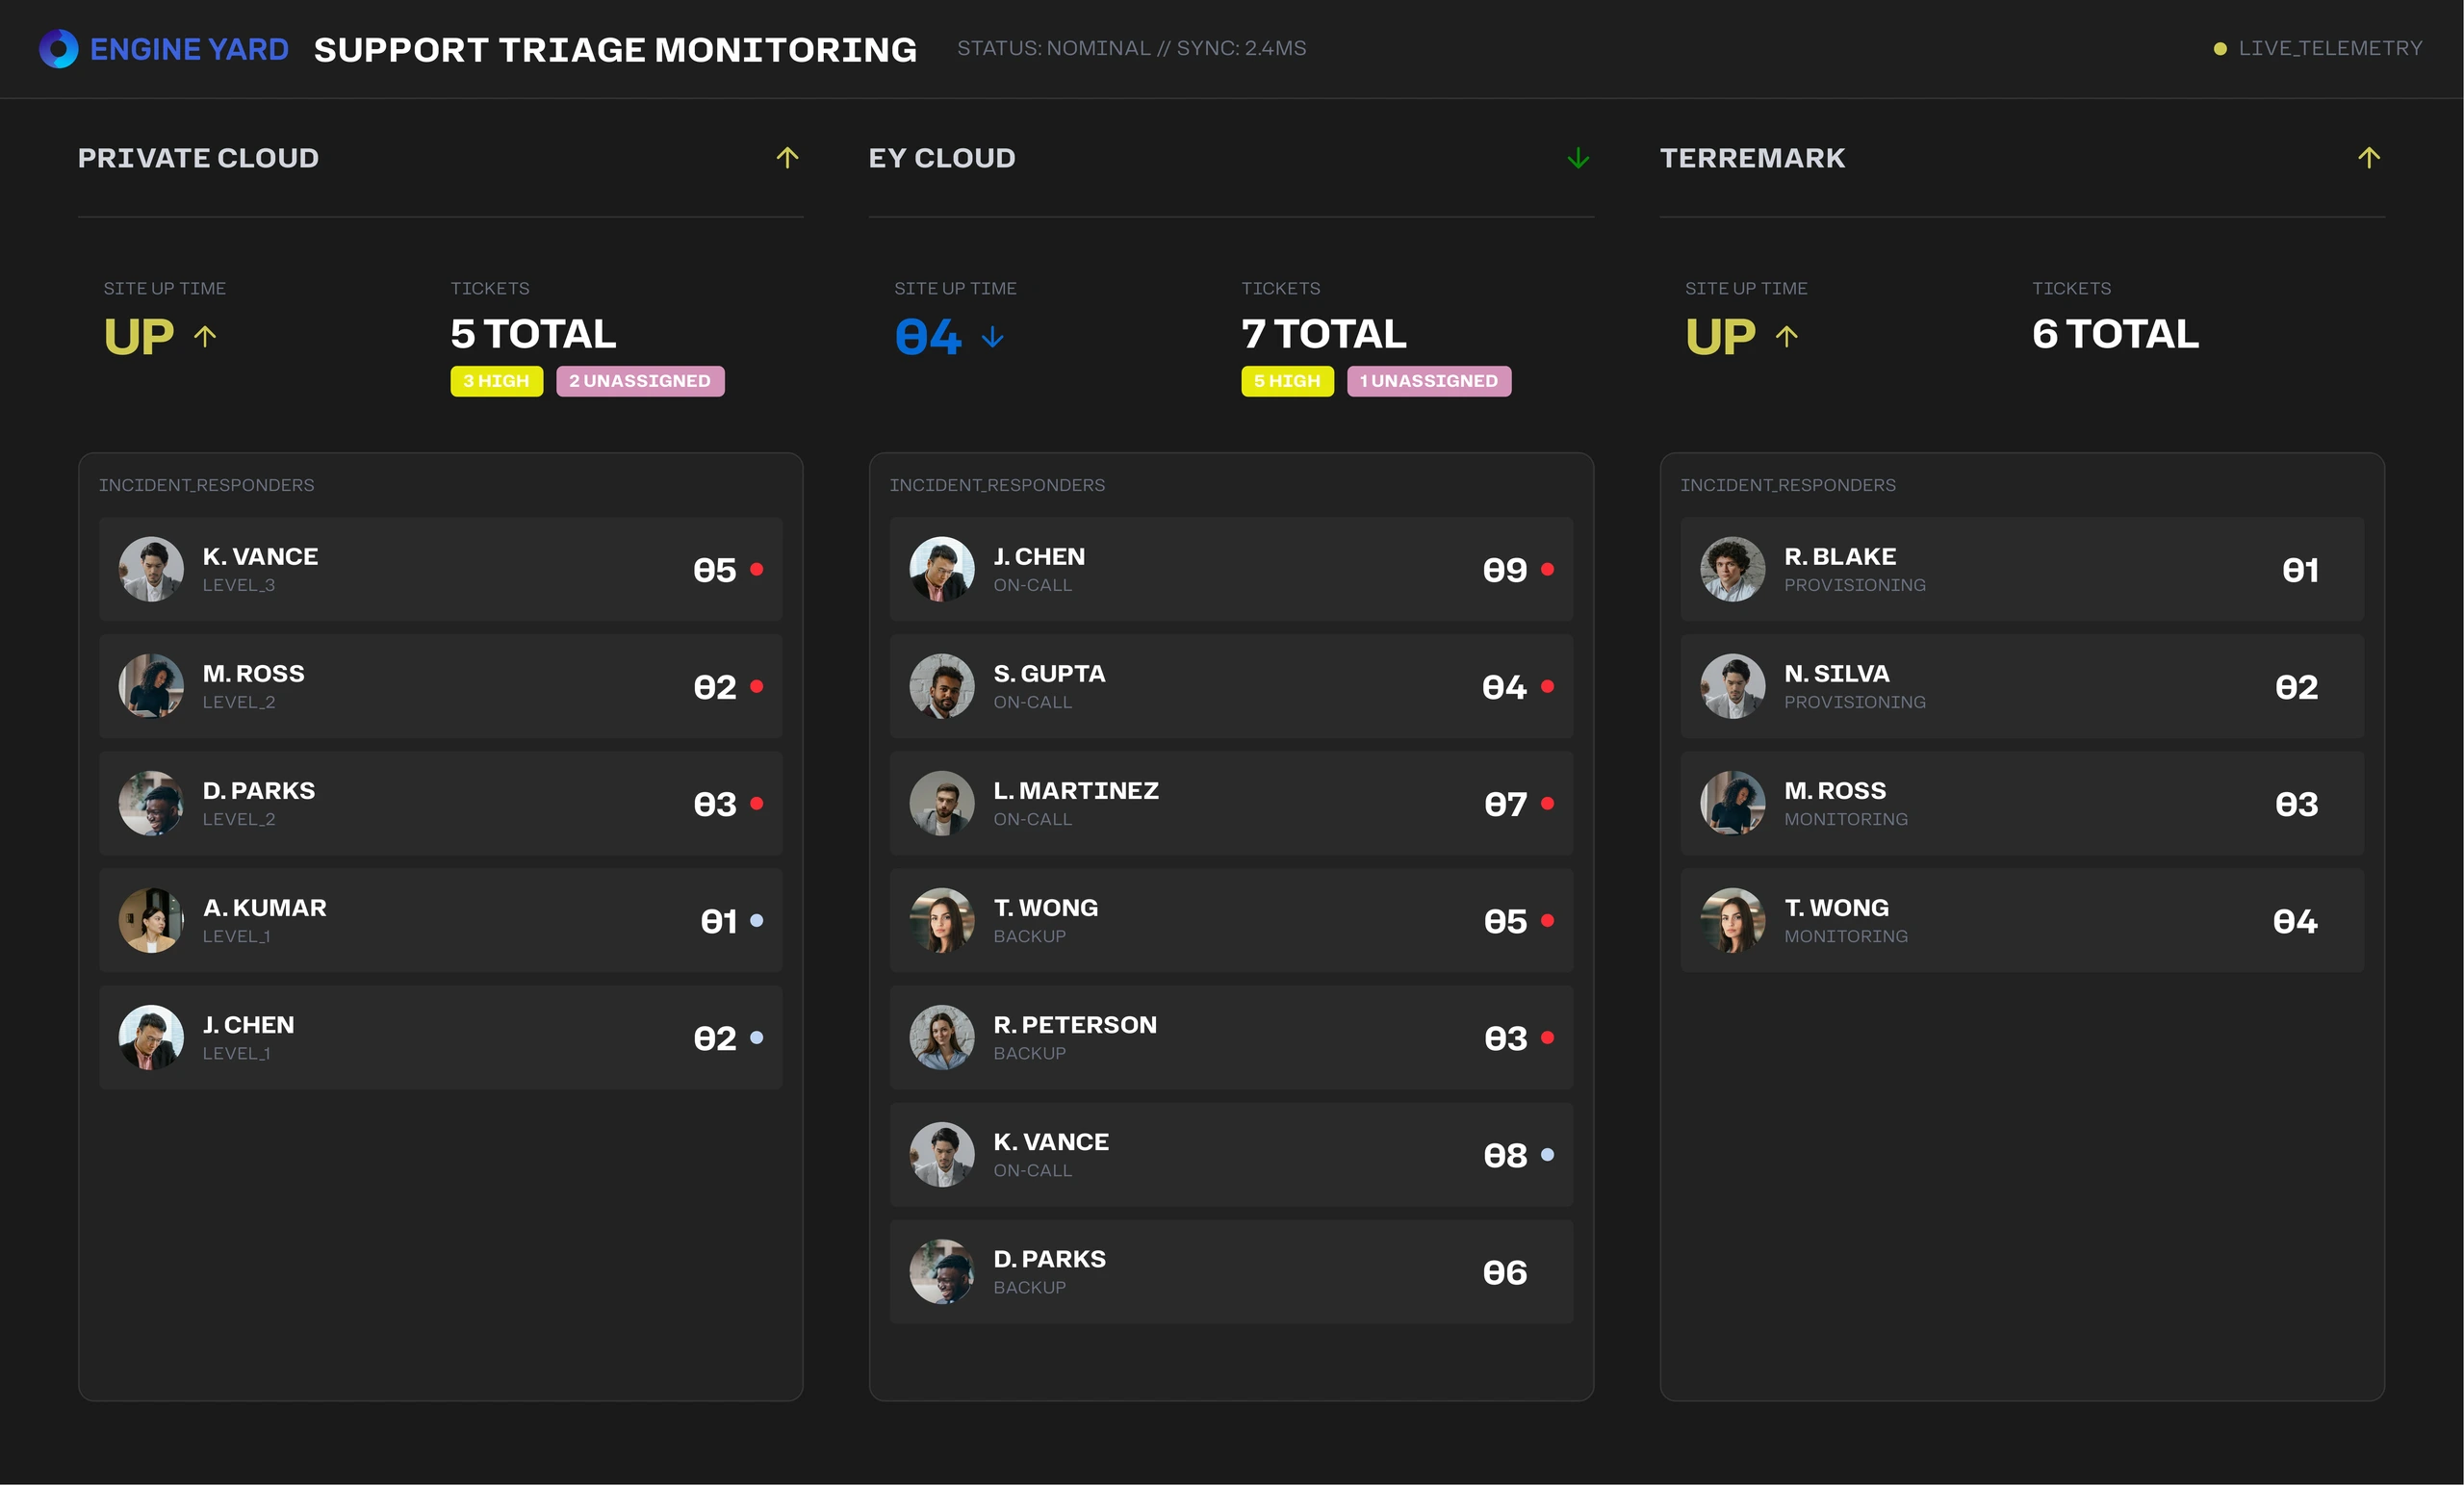
The top of each column focuses on the highest-level signals:
- Site uptime
- Ticket count
- Ticket priority
- Assignment status
- Trend direction
Below that, the responder cards show who is involved and how much operational load they are carrying. This was the most important interaction model in the design. The system is not just reporting incidents, it is showing accountability.
The visual system uses a restrained dark interface because the product belongs in an operations environment. The goal was to reduce glare, increase contrast, and make status changes visible from a distance. Color is used sparingly: green or yellow for status, blue for system state, red for attention, and muted labels for secondary context.
I avoided making every metric compete for attention. The hierarchy is intentionally blunt:
- Is the environment up?
- How many tickets are active?
- Which tickets are high priority?
- Who is responding?
- Is the system trending better or worse?
That structure turns the dashboard into a decision aid. A support lead can quickly understand whether the team is stable, overloaded, or drifting toward an incident response moment.
And there is an important design choice: the people are not hidden behind abstract counts. Responder identity is visible because triage is a human coordination problem, not just a data problem. By pairing operational state with human ownership, the interface helps teams move faster without losing accountability.