Clients & Ventures
Product/systems design that turns AI tech into business results


Contact Us
Contact form or information will go here.
Project Detail
GEO – Global Energy Optimizer
Summary
A geospatial solar planning platform for defining sites, simulating layouts, optimizing system parameters, and generating project proposals.
Utility-scale solar planning required teams to evaluate large sites, compare system assumptions, estimate production, and translate early feasibility into proposal-ready project data.
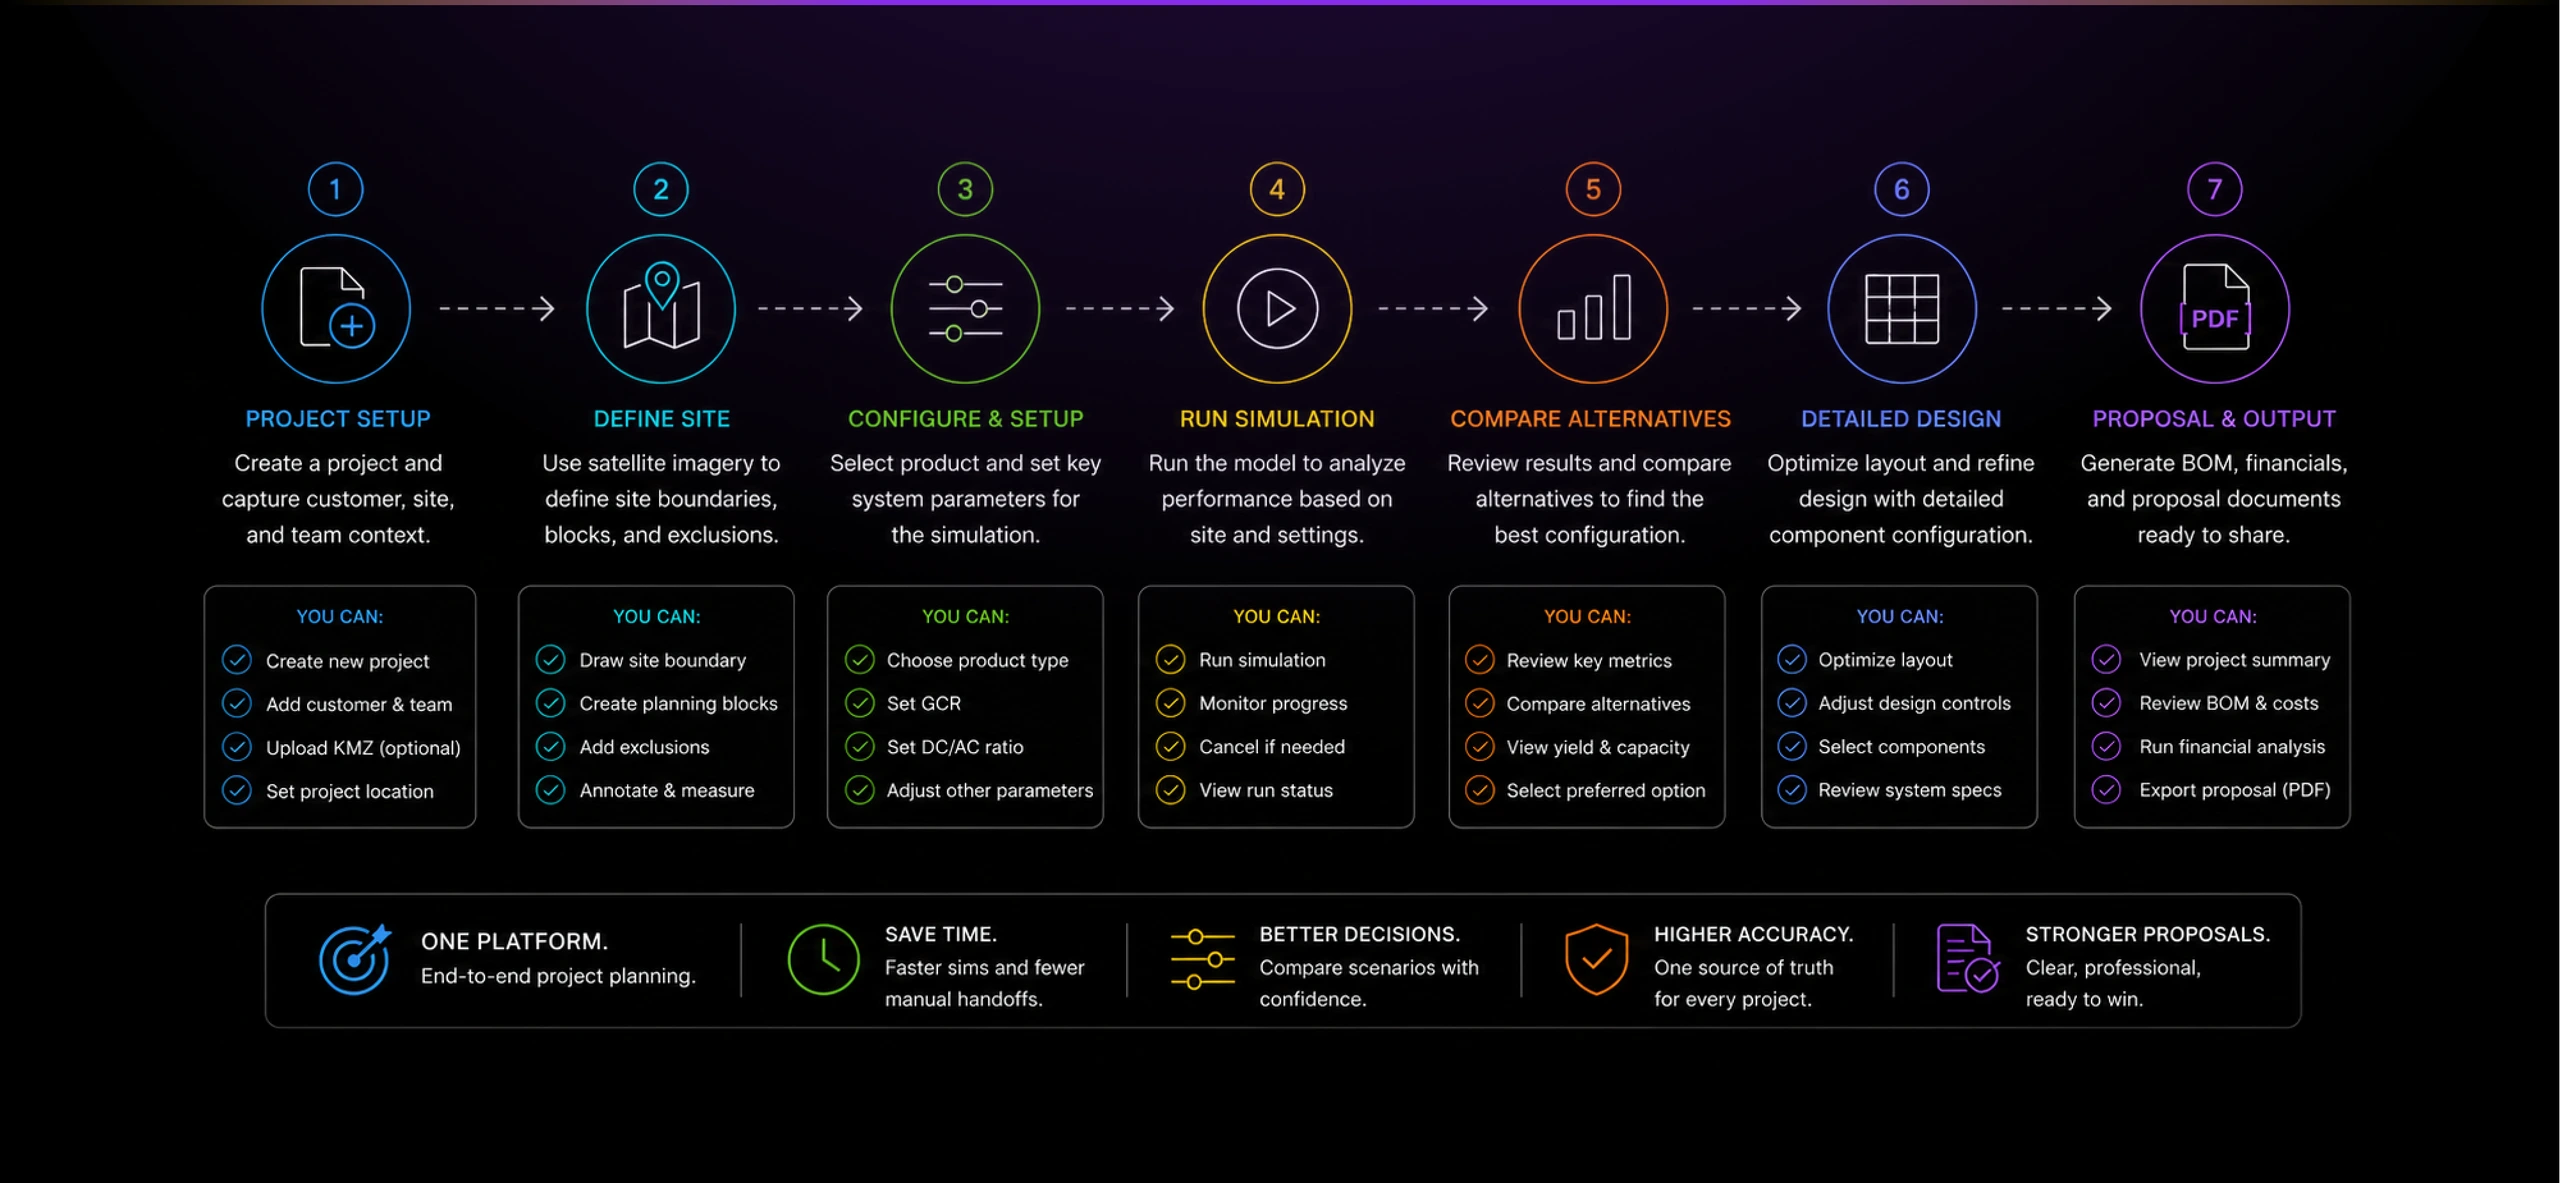
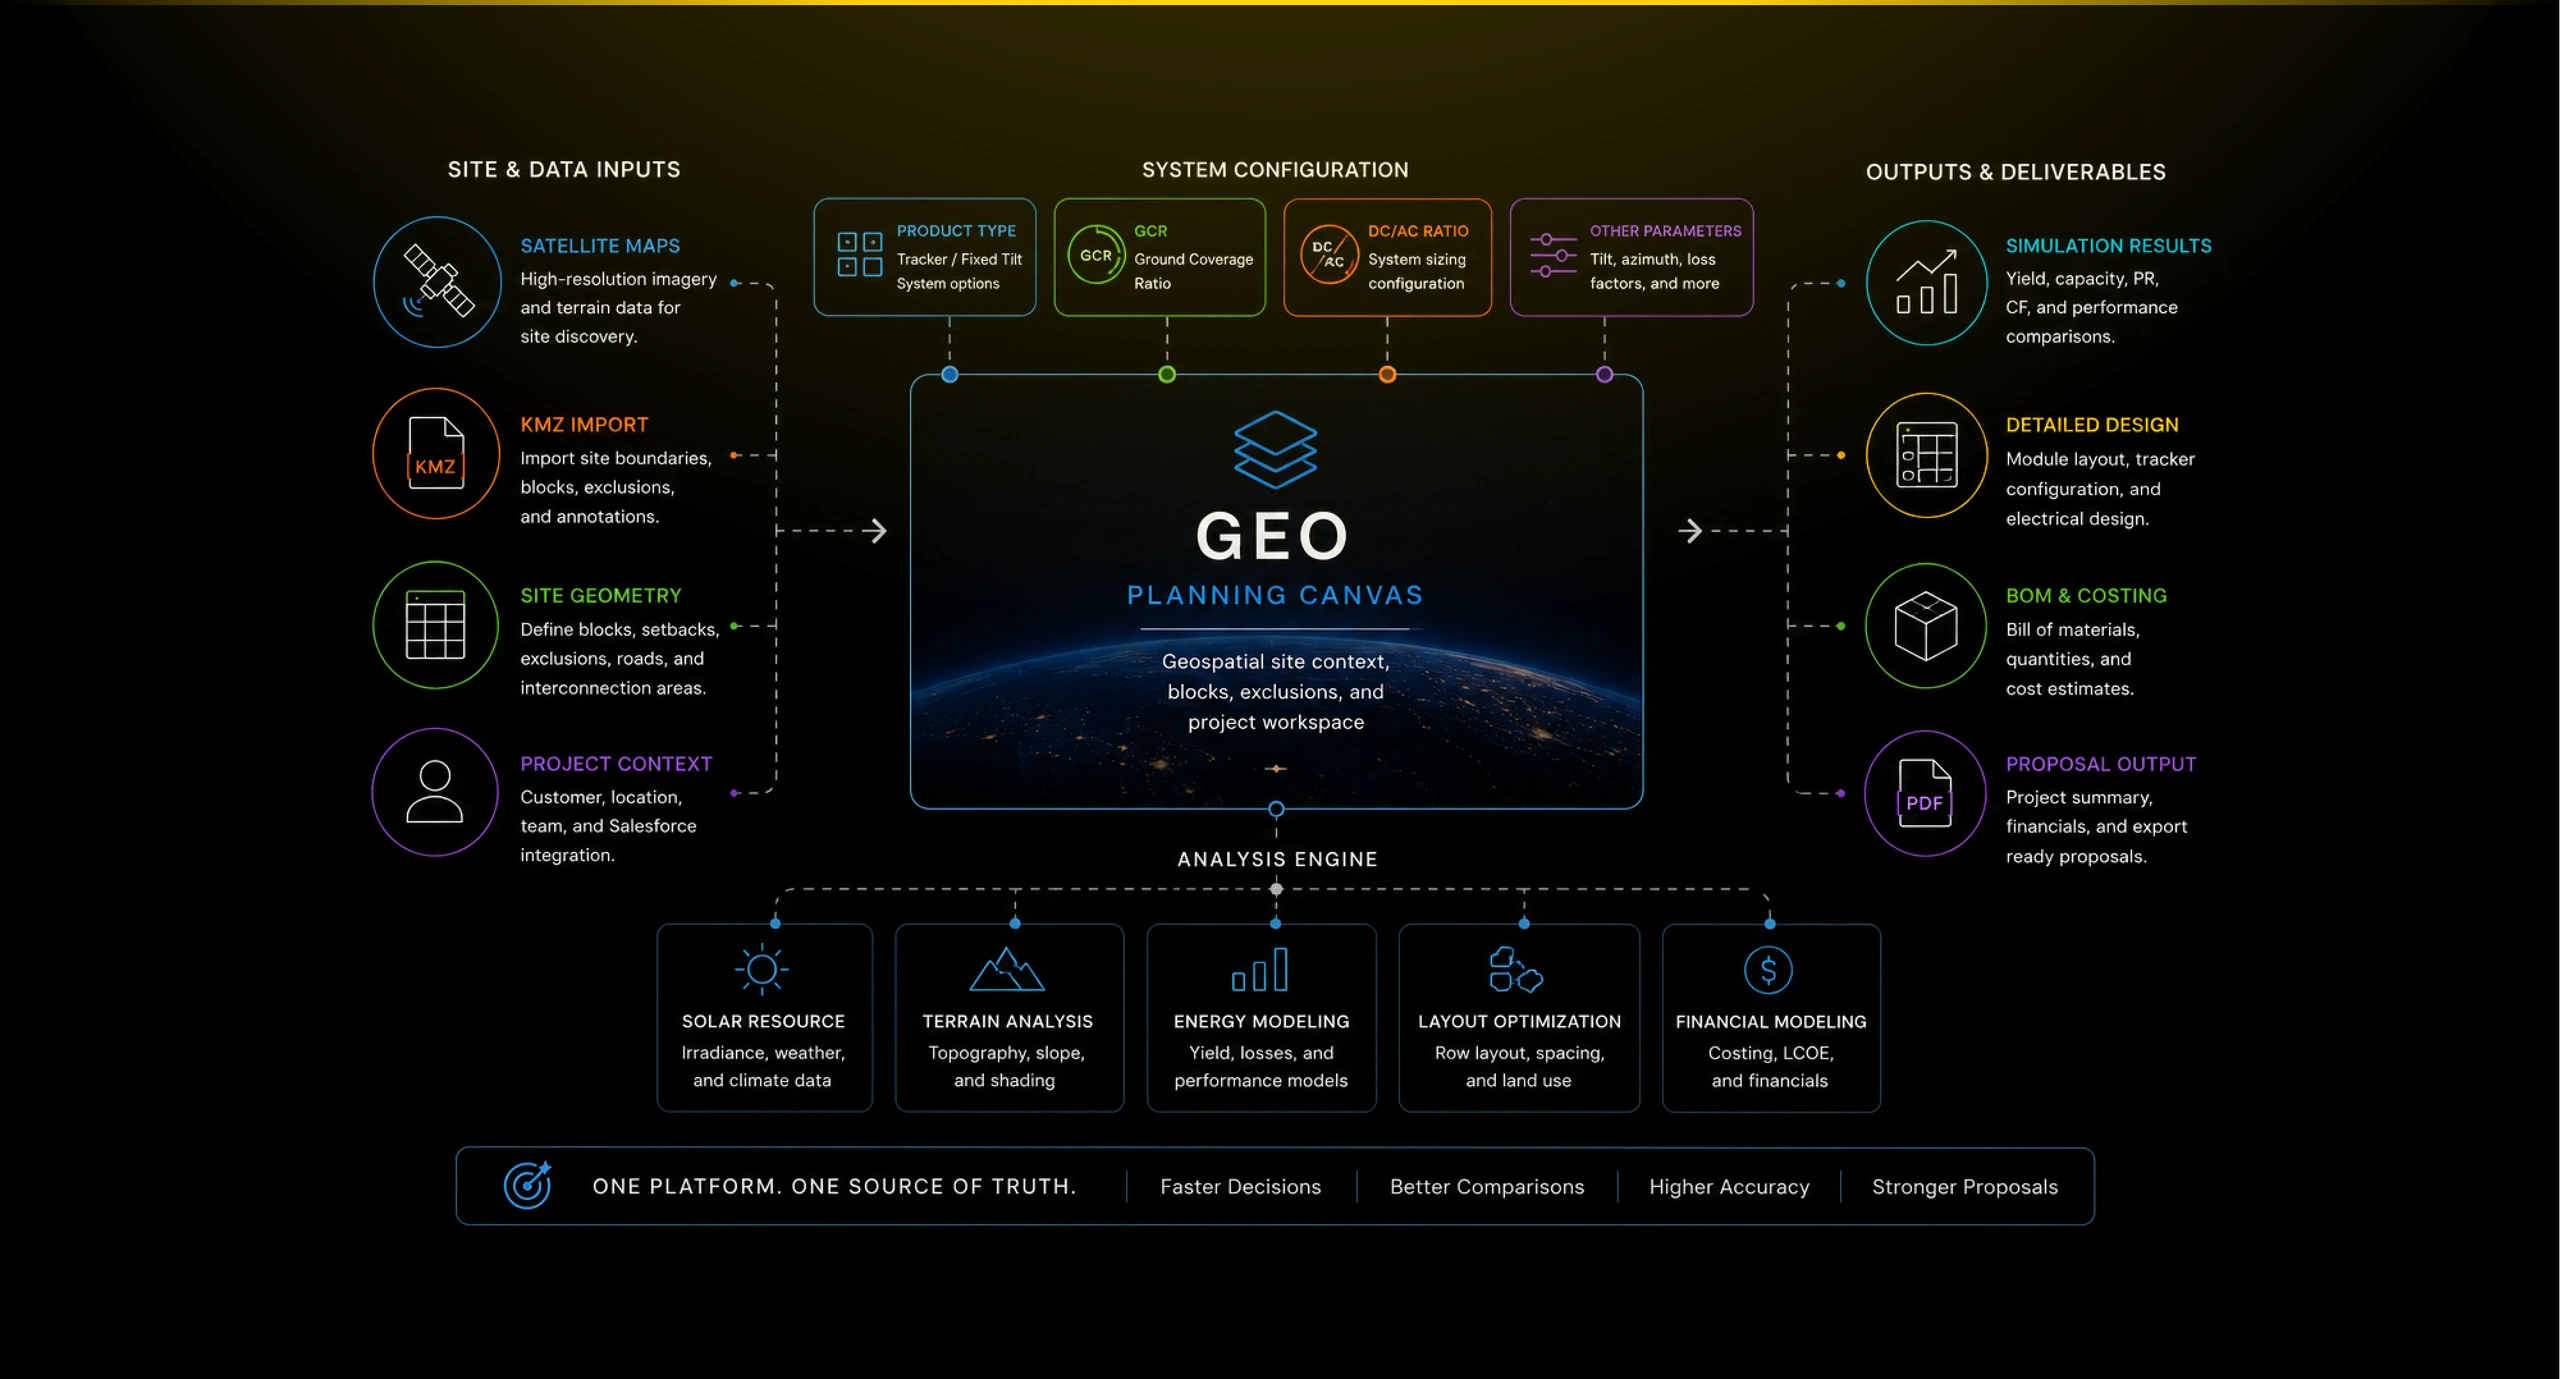
I designed GEO as a geospatial planning tool that connected satellite maps, site blocks, exclusions, simulations, layout parameters, BOM estimates, and proposal outputs in one workflow.
Outcome
GEO made early solar planning more connected and decision-ready.
GEO gave utility-scale teams a clearer way to move from a potential site to a structured project plan. It connected geospatial context, system assumptions, simulation results, design controls, and proposal outputs into one working environment.
Estimated impact based on project context:
- Faster early-stage site evaluation
- Clearer comparison of product and configuration alternatives
- Better continuity between mapping, simulation, and proposal work
- Reduced manual translation between planning tools and business outputs
- More confidence when evaluating capacity, yield, and layout tradeoffs
- A stronger foundation for utility-scale solar project planning
The project mattered because it treated solar planning as an integrated system. GEO connected spatial reasoning, engineering assumptions, and commercial outputs into one product experience.
The Problem
Utility-scale planning needed speed without losing technical judgment.
Large solar projects start with uncertainty. Teams need to understand land area, site boundaries, terrain, product configuration, capacity, yield, constraints, customer context, and financial viability before a project can move forward.
That work often happens across disconnected tools: mapping software, spreadsheets, engineering assumptions, separate proposal documents, and manual analysis. Each handoff adds friction and makes it harder to compare scenarios quickly.
The challenge was not just showing a map. The product needed to help teams turn a potential solar site into a structured planning model that could support simulation, design refinement, and proposal work.
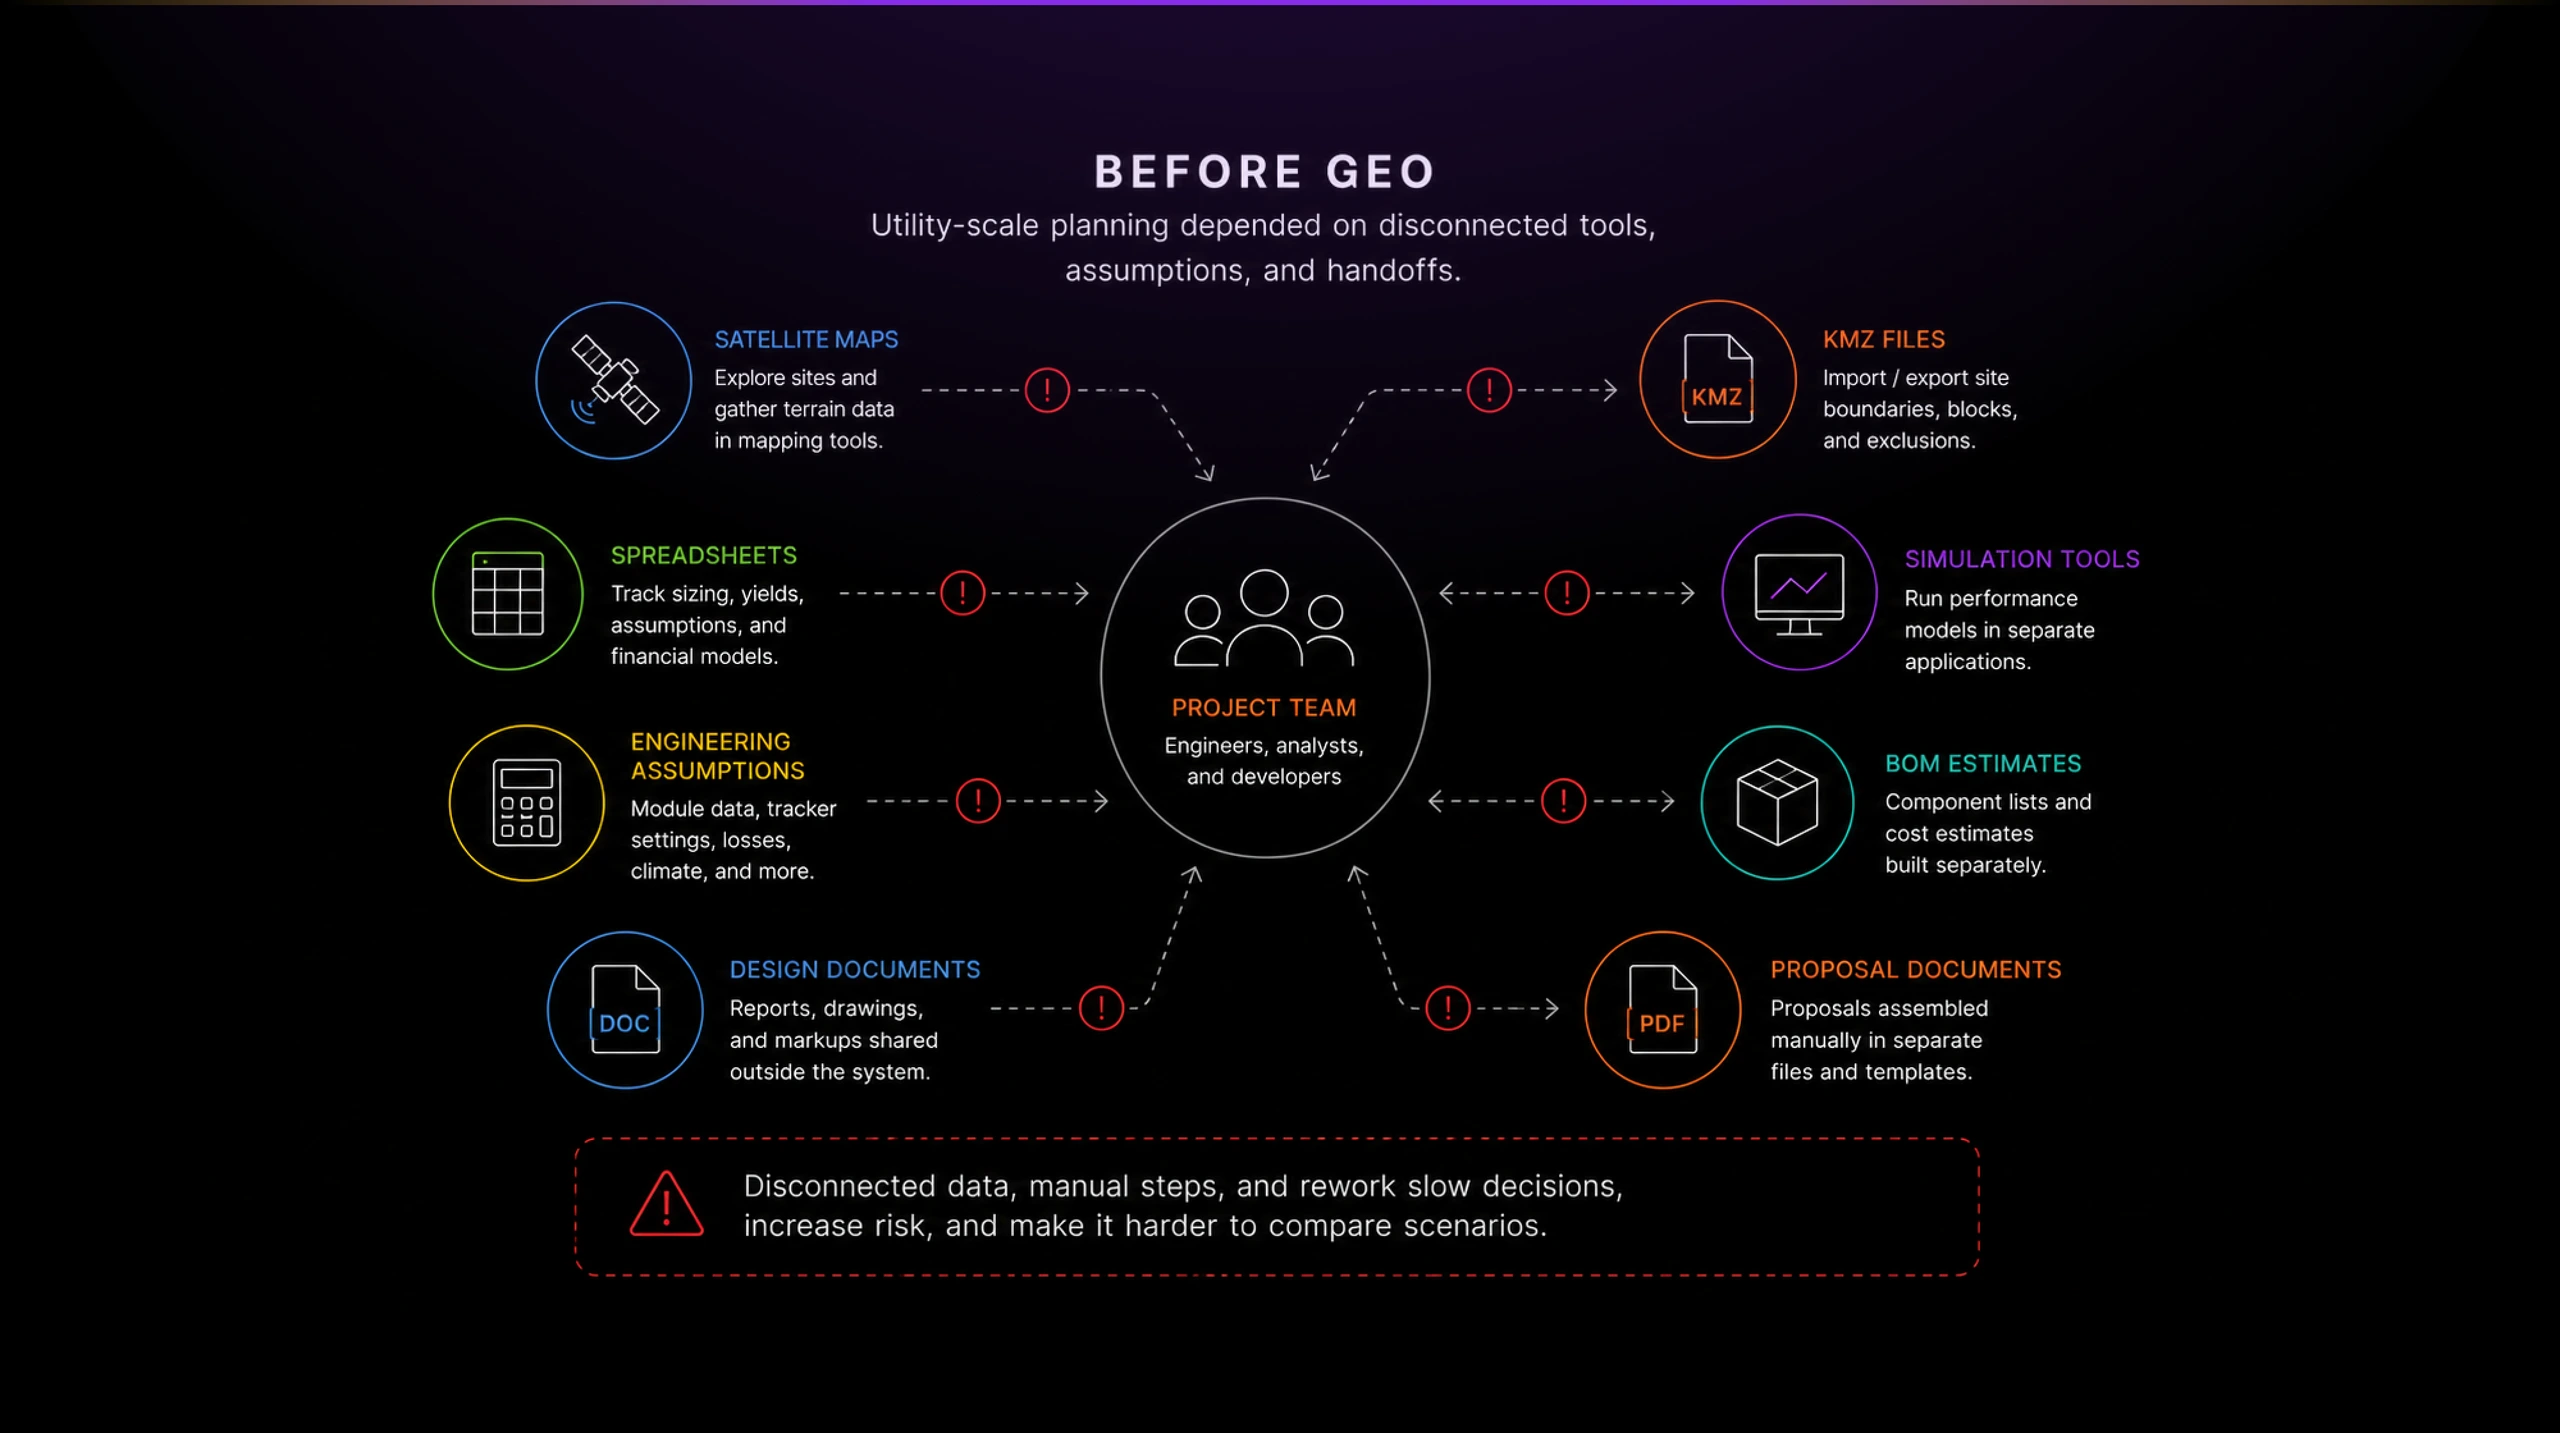
Without a unified planning environment, early-stage decisions were slower, harder to compare, and more dependent on manual translation between design, engineering, and business teams.
Solution
Turning the map into the operating surface.
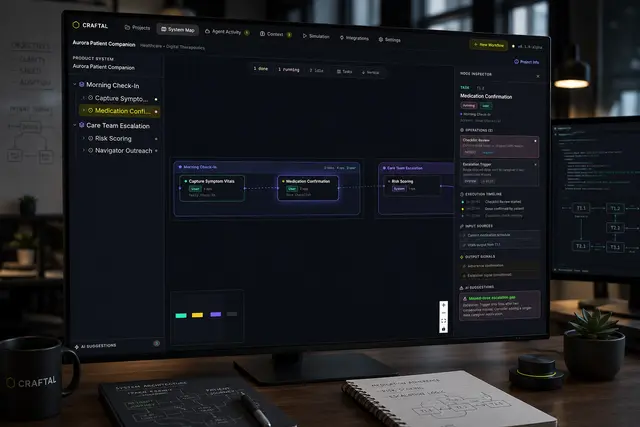
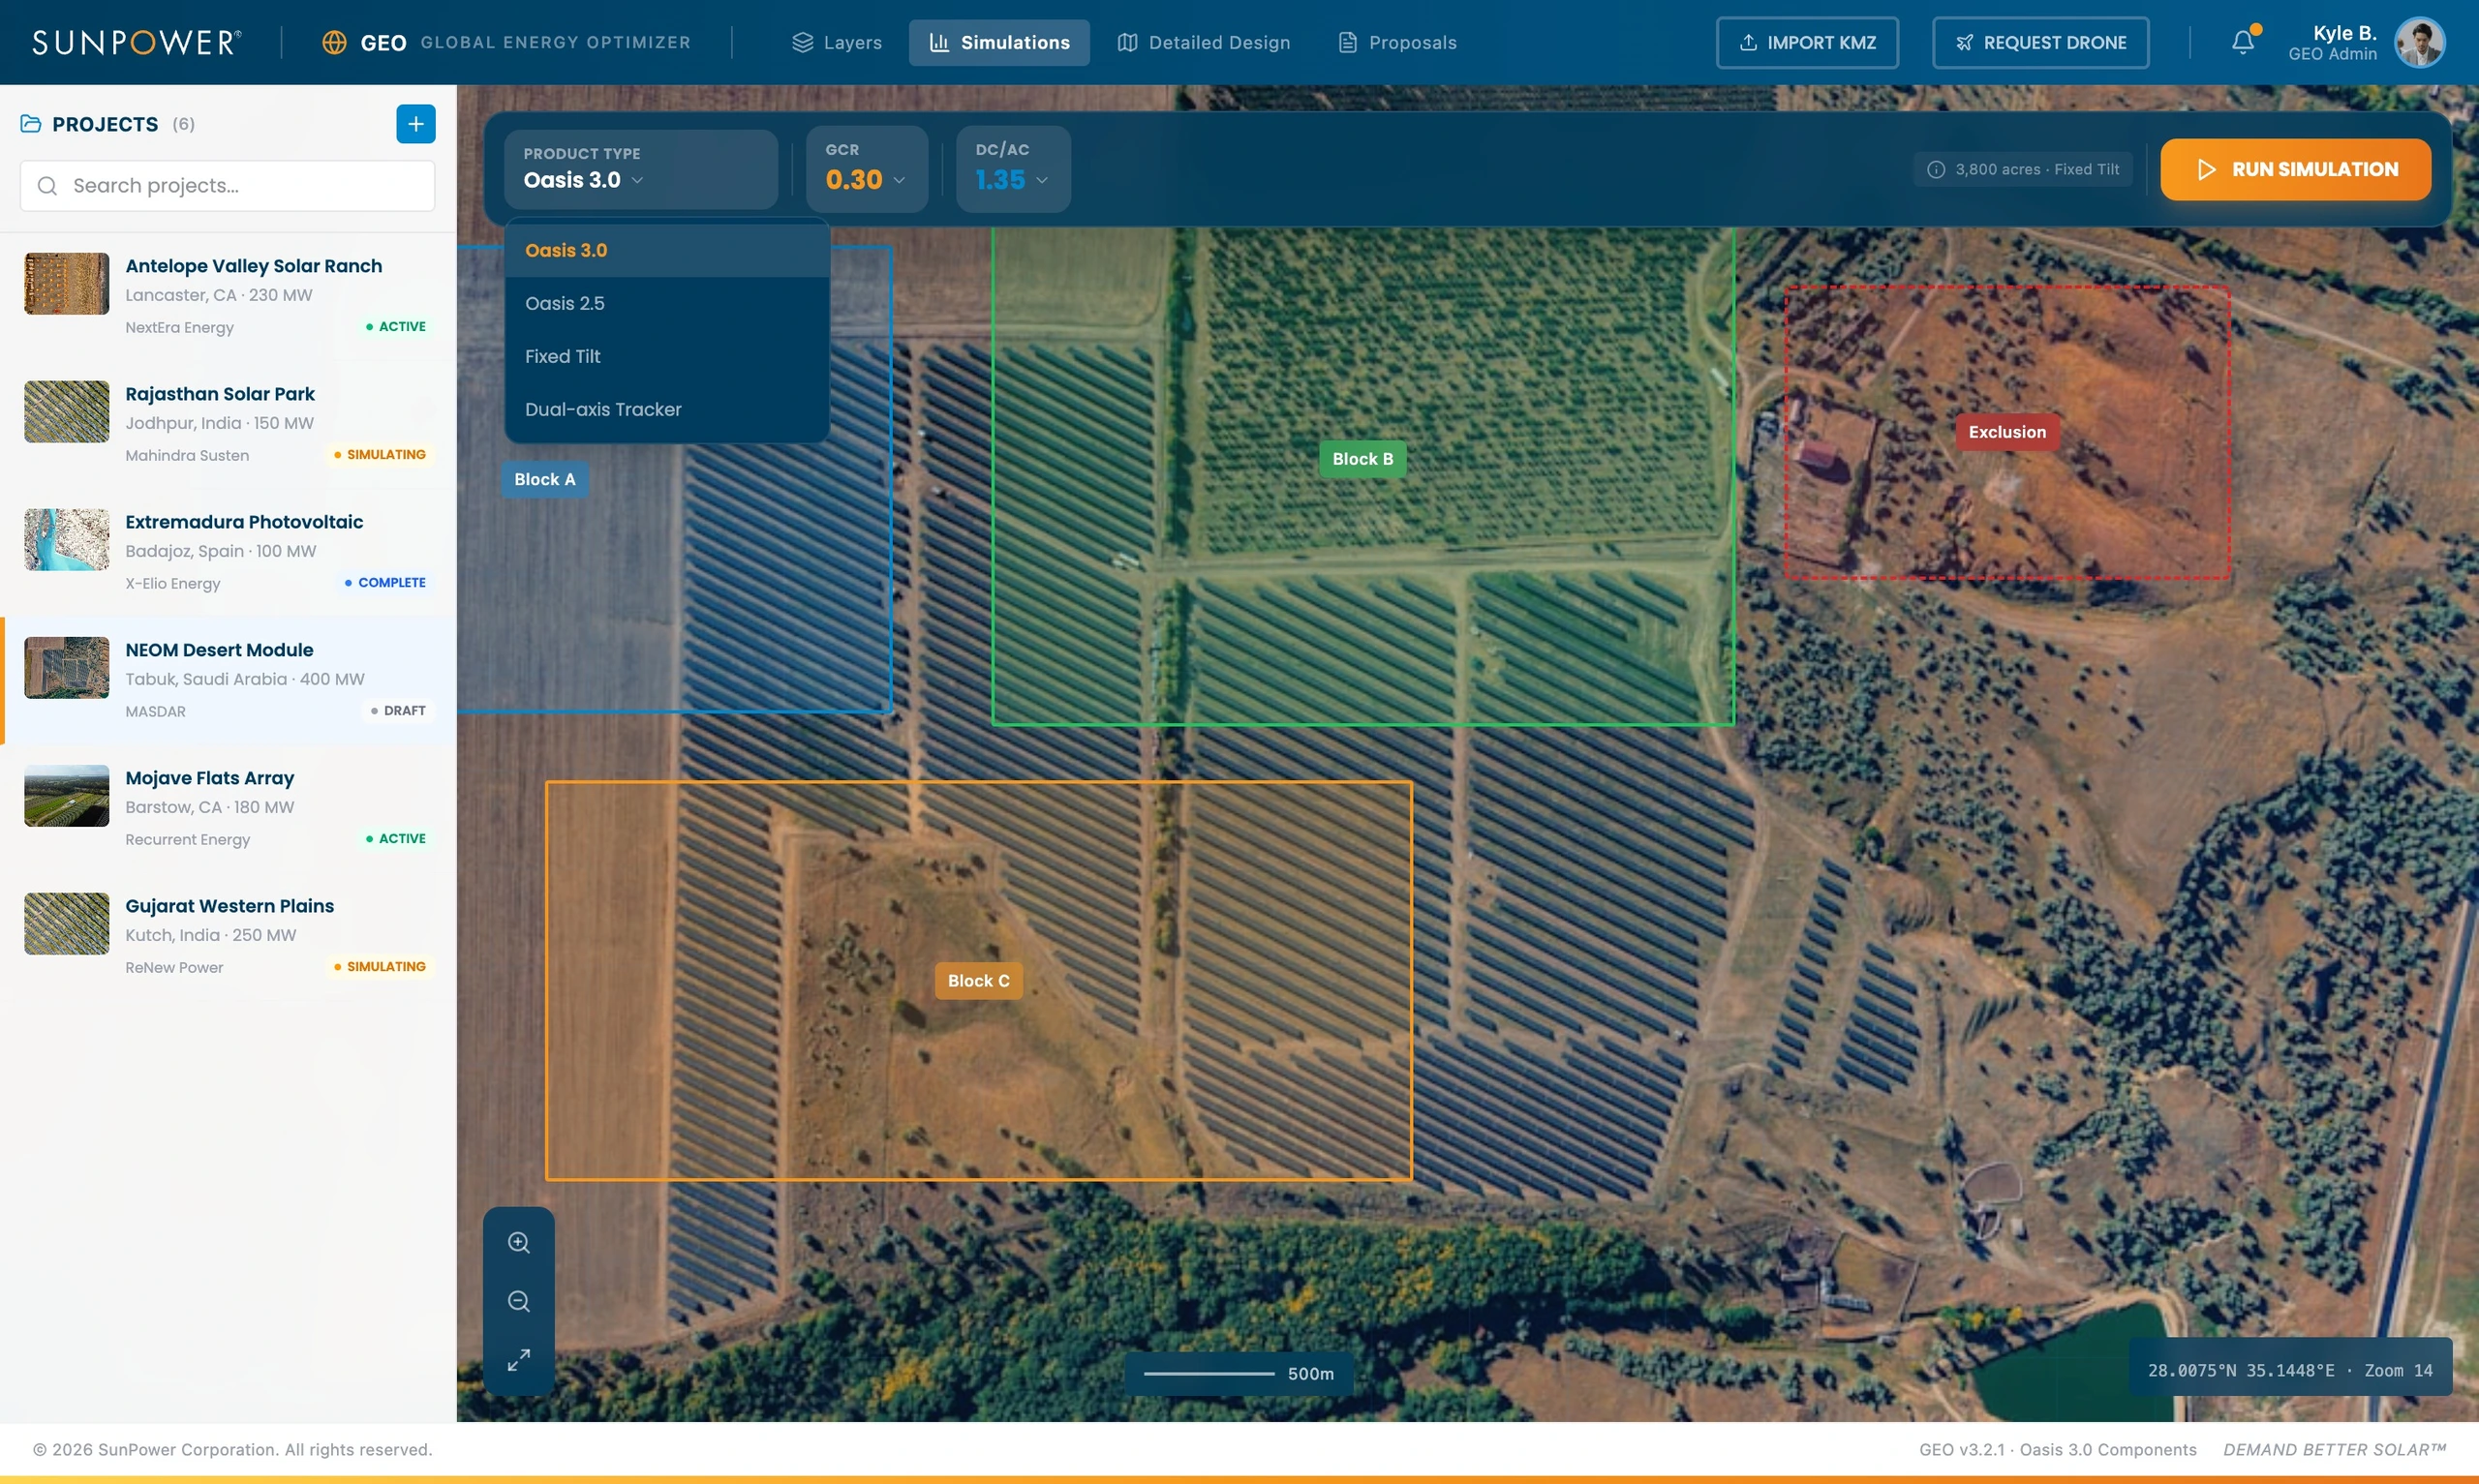
I designed GEO around the idea that the satellite map should not be a passive backdrop. It should become the primary working surface for solar planning.
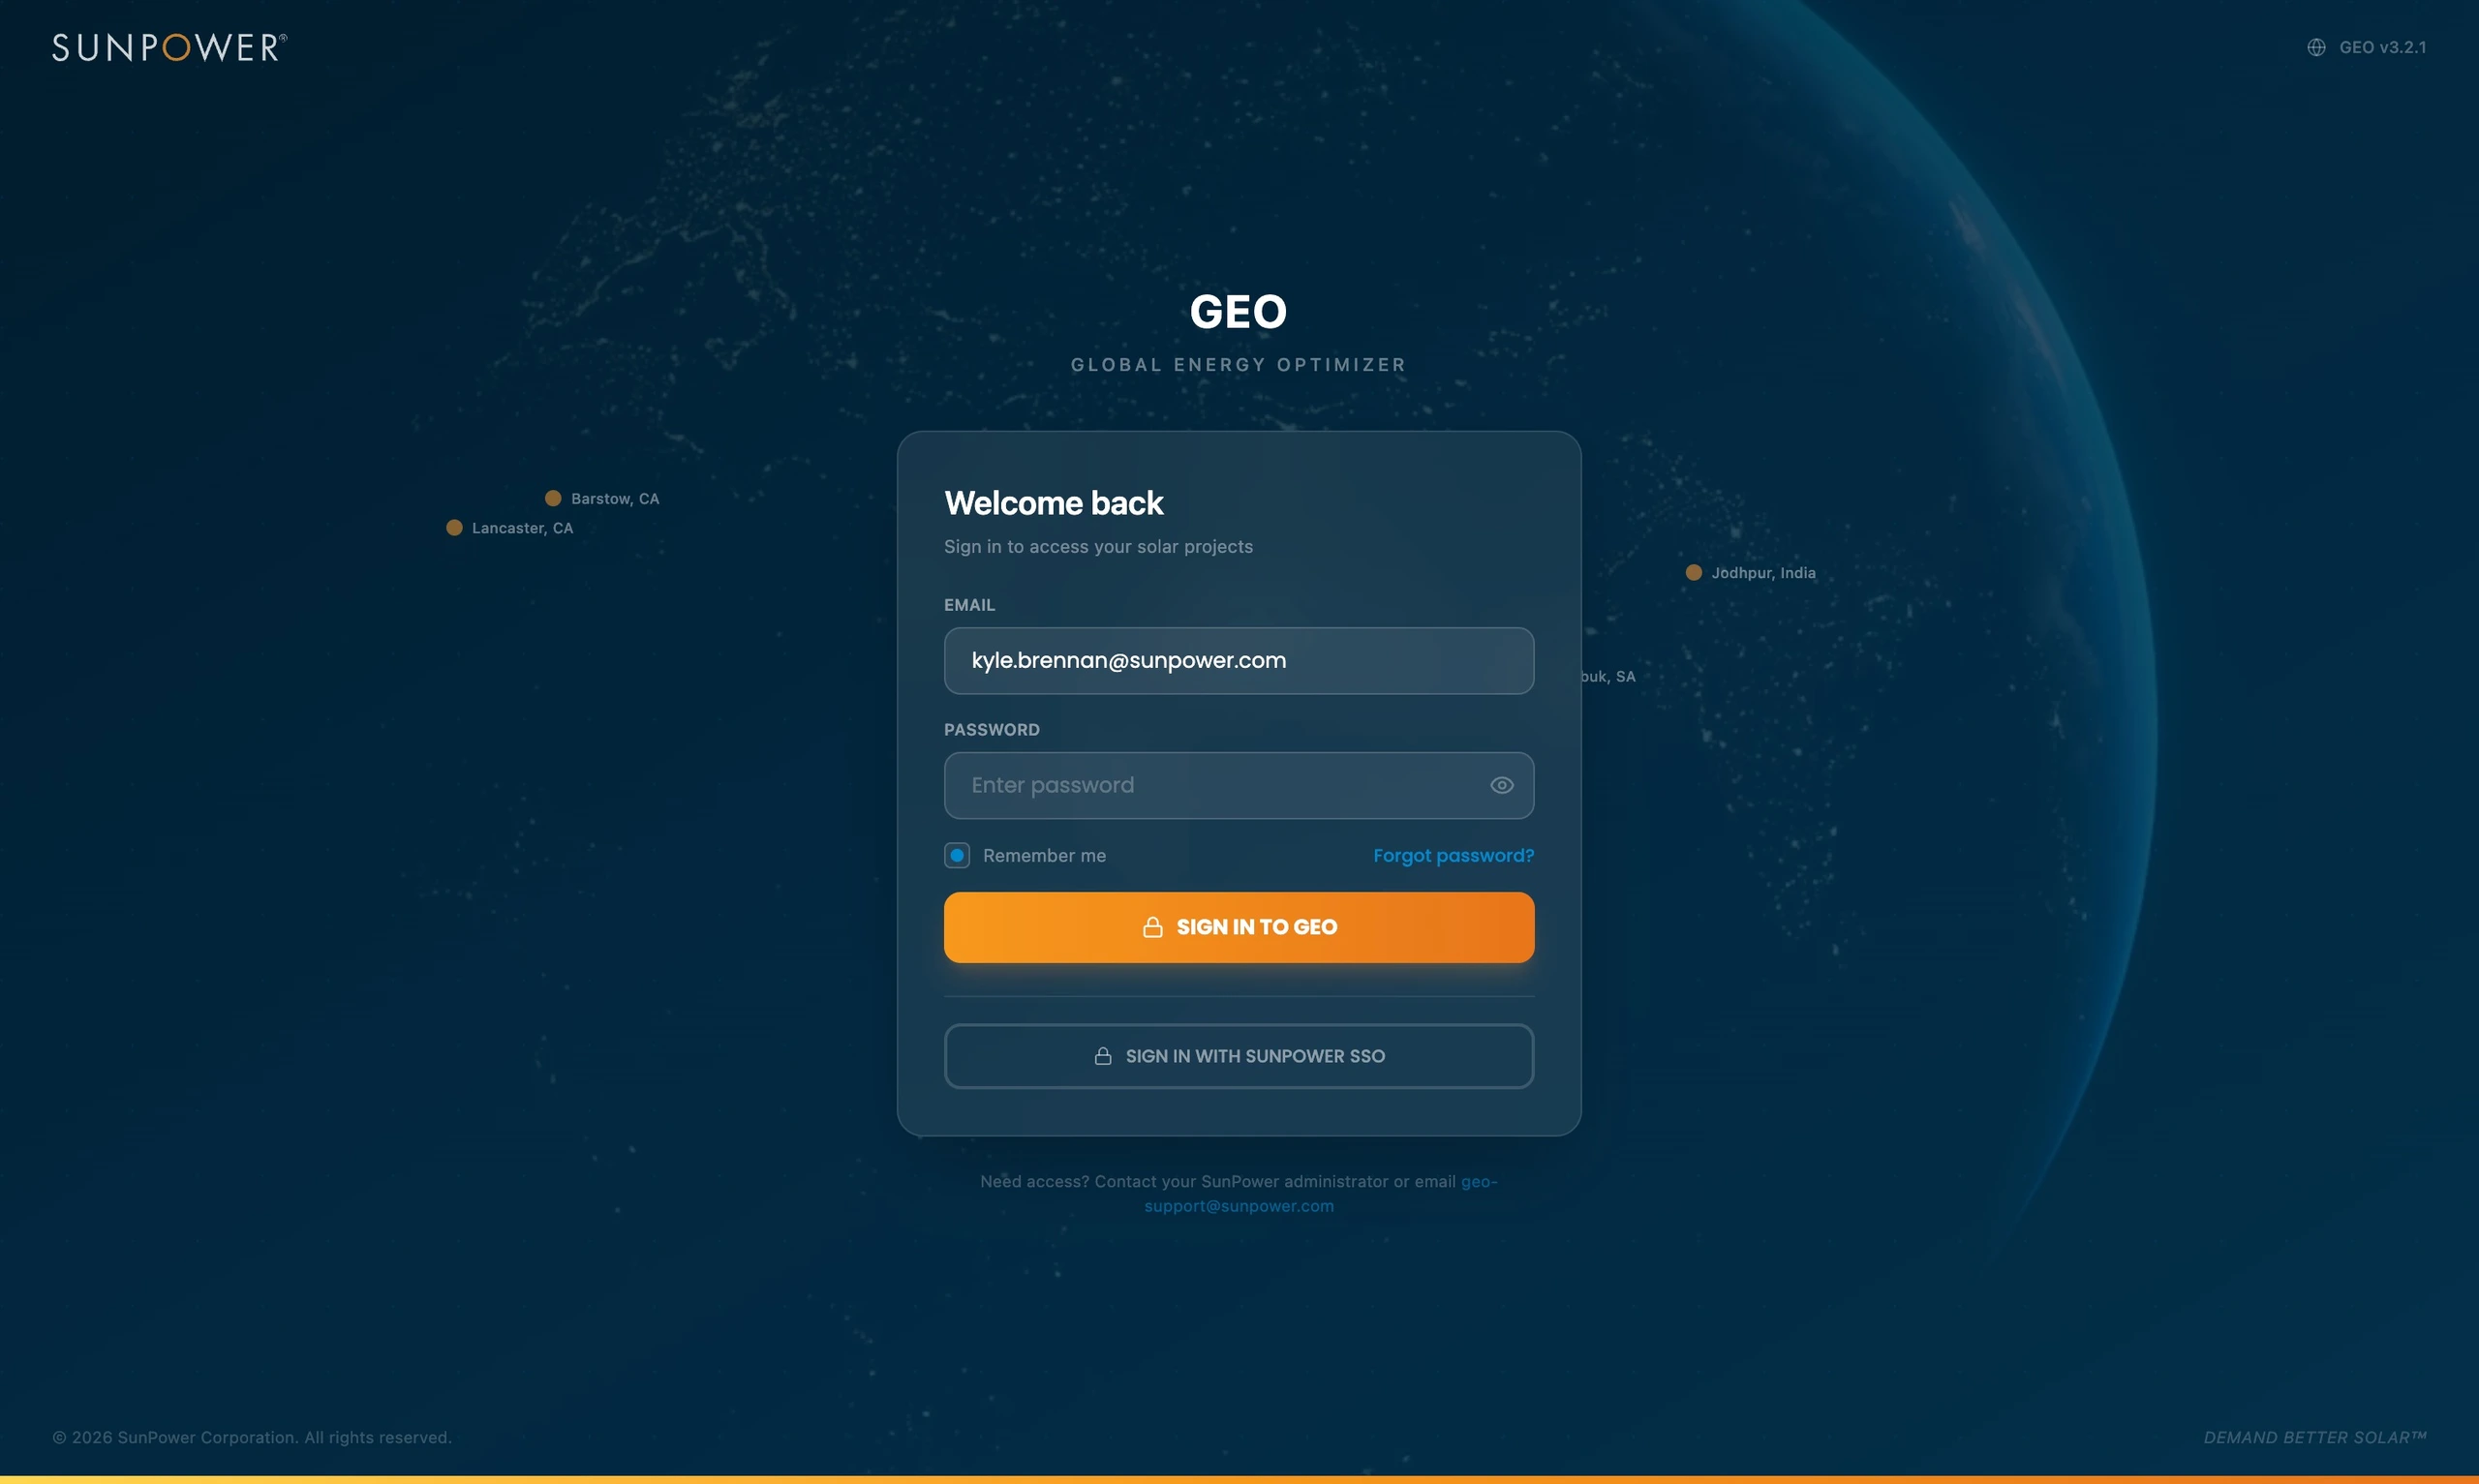
The login and opening experience established the product as a global planning environment, with projects distributed across geographies and energy markets.
Once inside a project, the map became the center of the workflow. Teams could see solar sites, project lists, geographic context, site boundaries, planning blocks, and exclusion zones in one place.
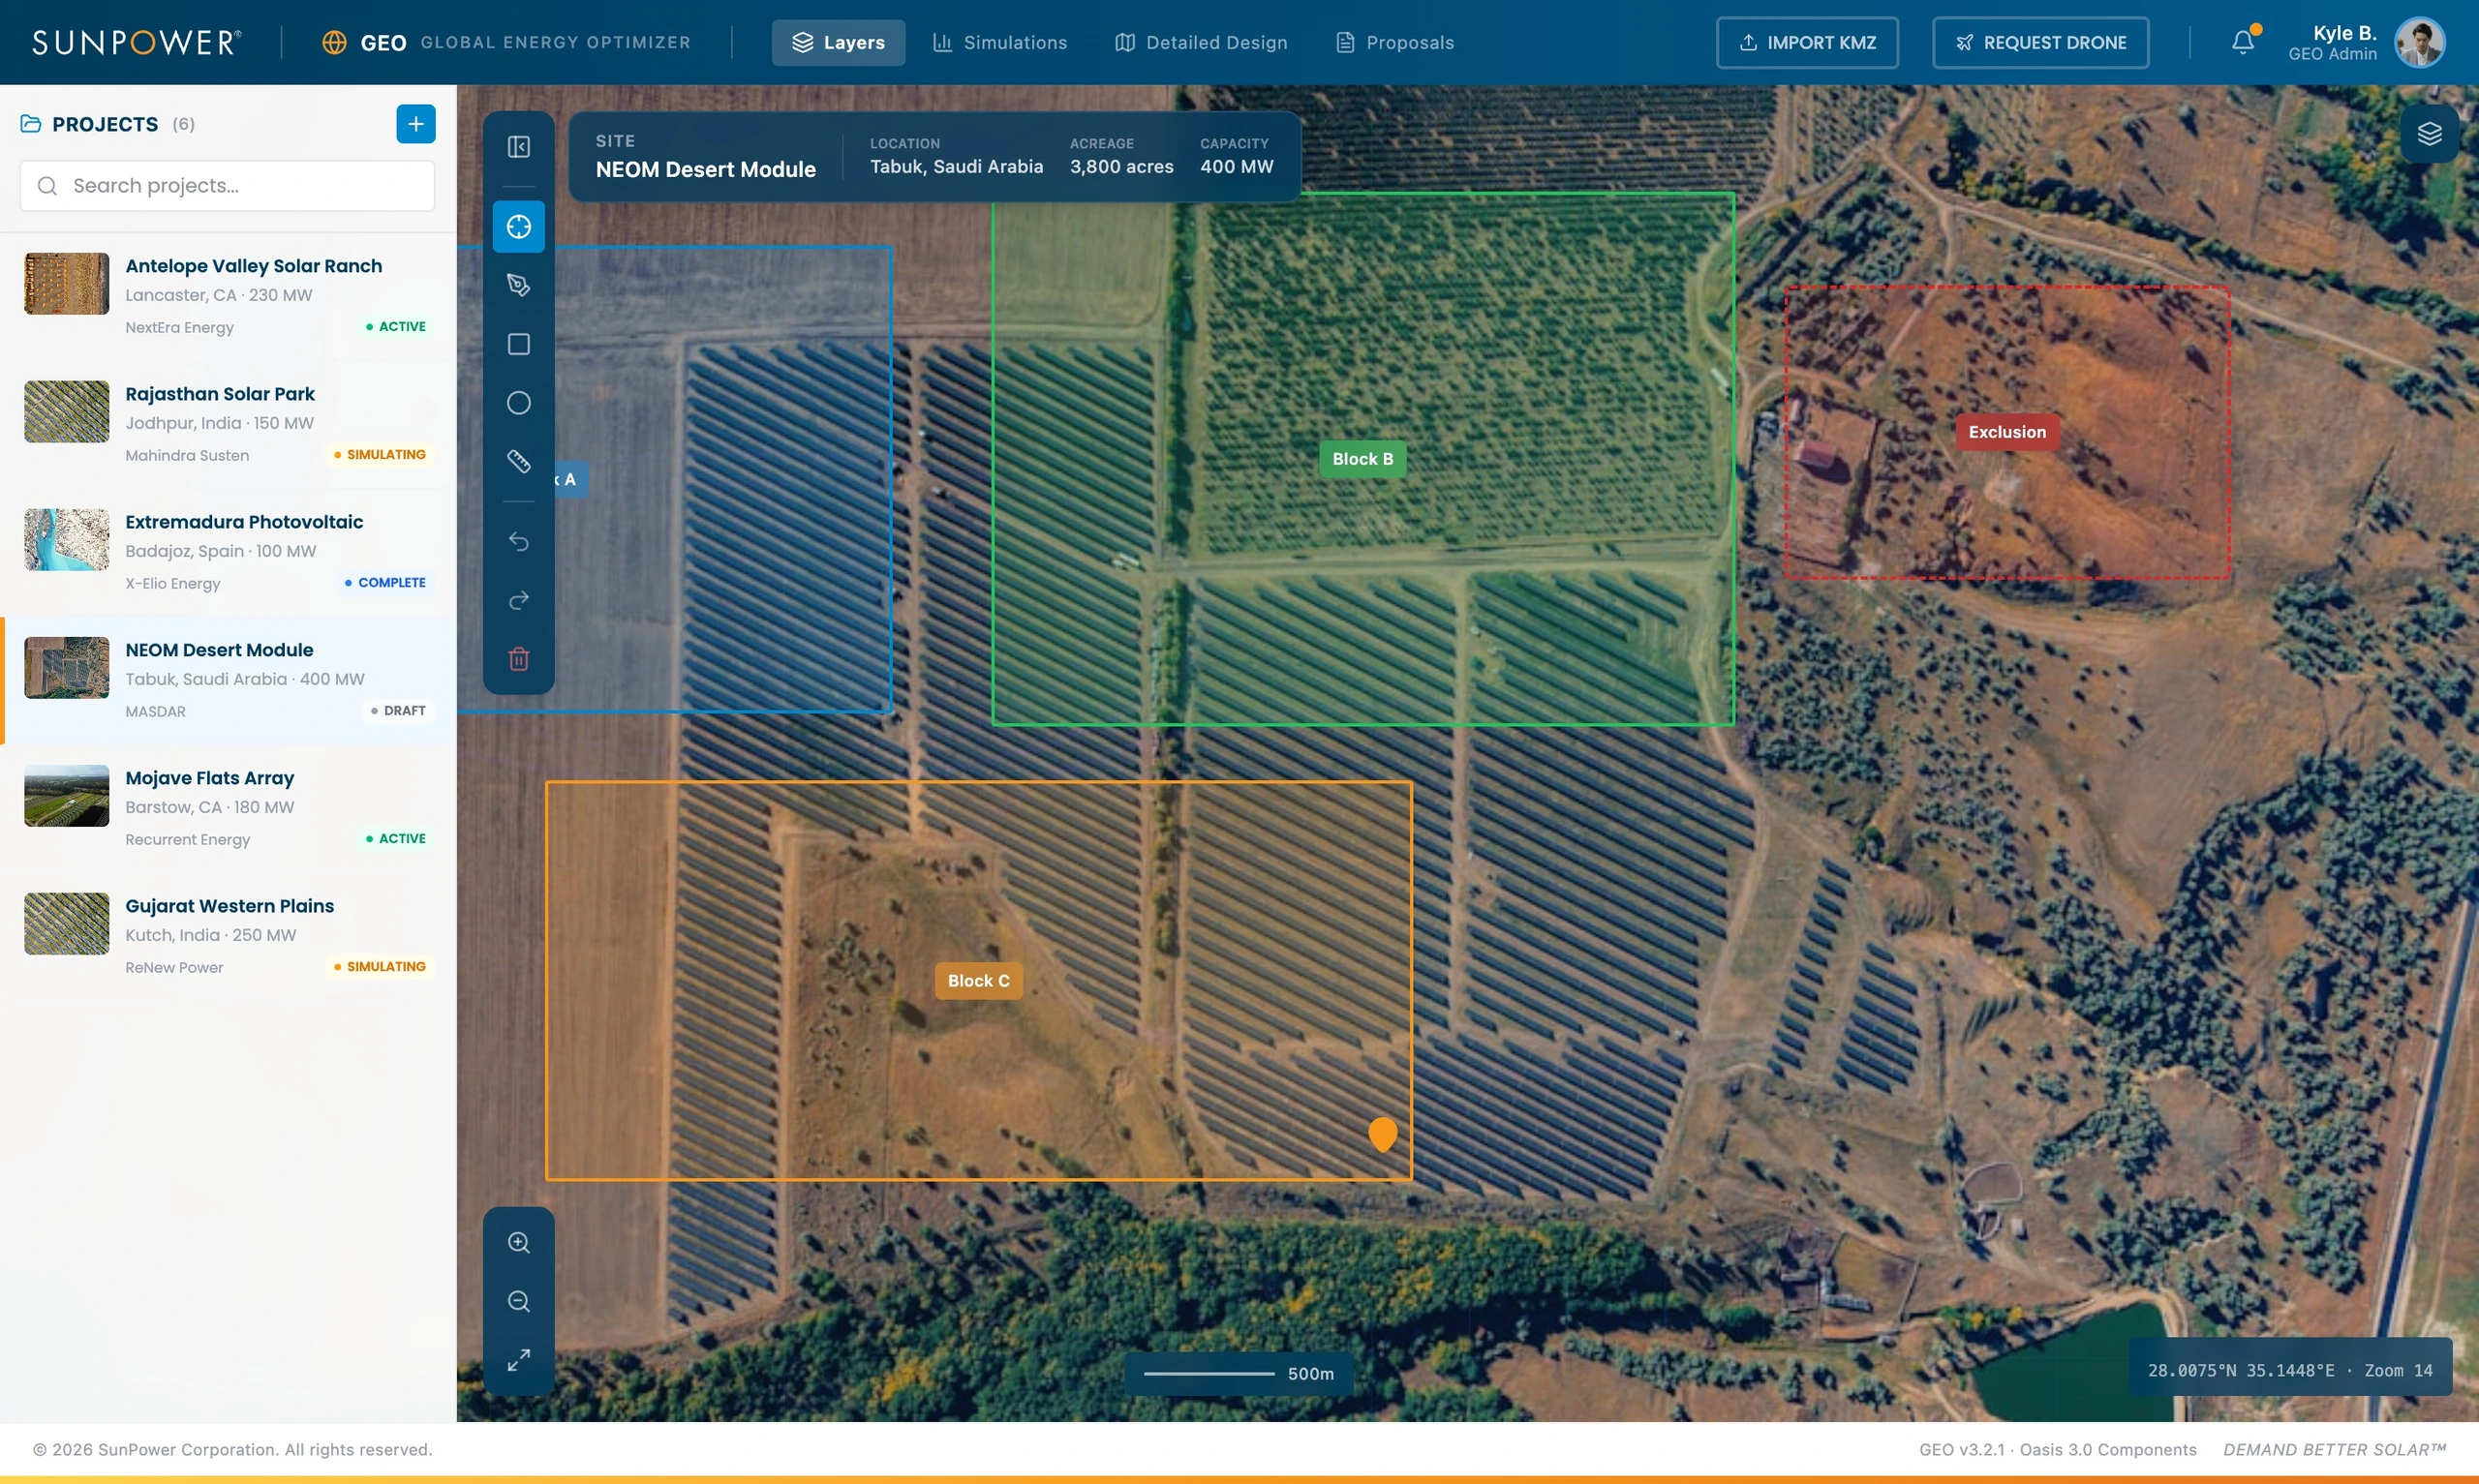
This was the important design decision: GEO had to feel like a planning cockpit, not a form-based engineering tool. The user needed to stay oriented spatially while adjusting assumptions and moving toward analysis.
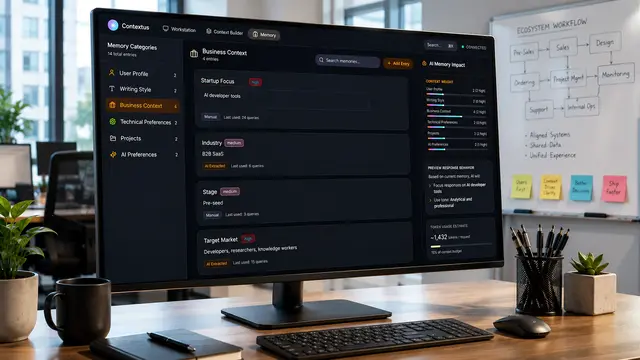
Creating projects without breaking map context
Project creation had to feel lightweight because teams might evaluate multiple candidate sites before a project became real.
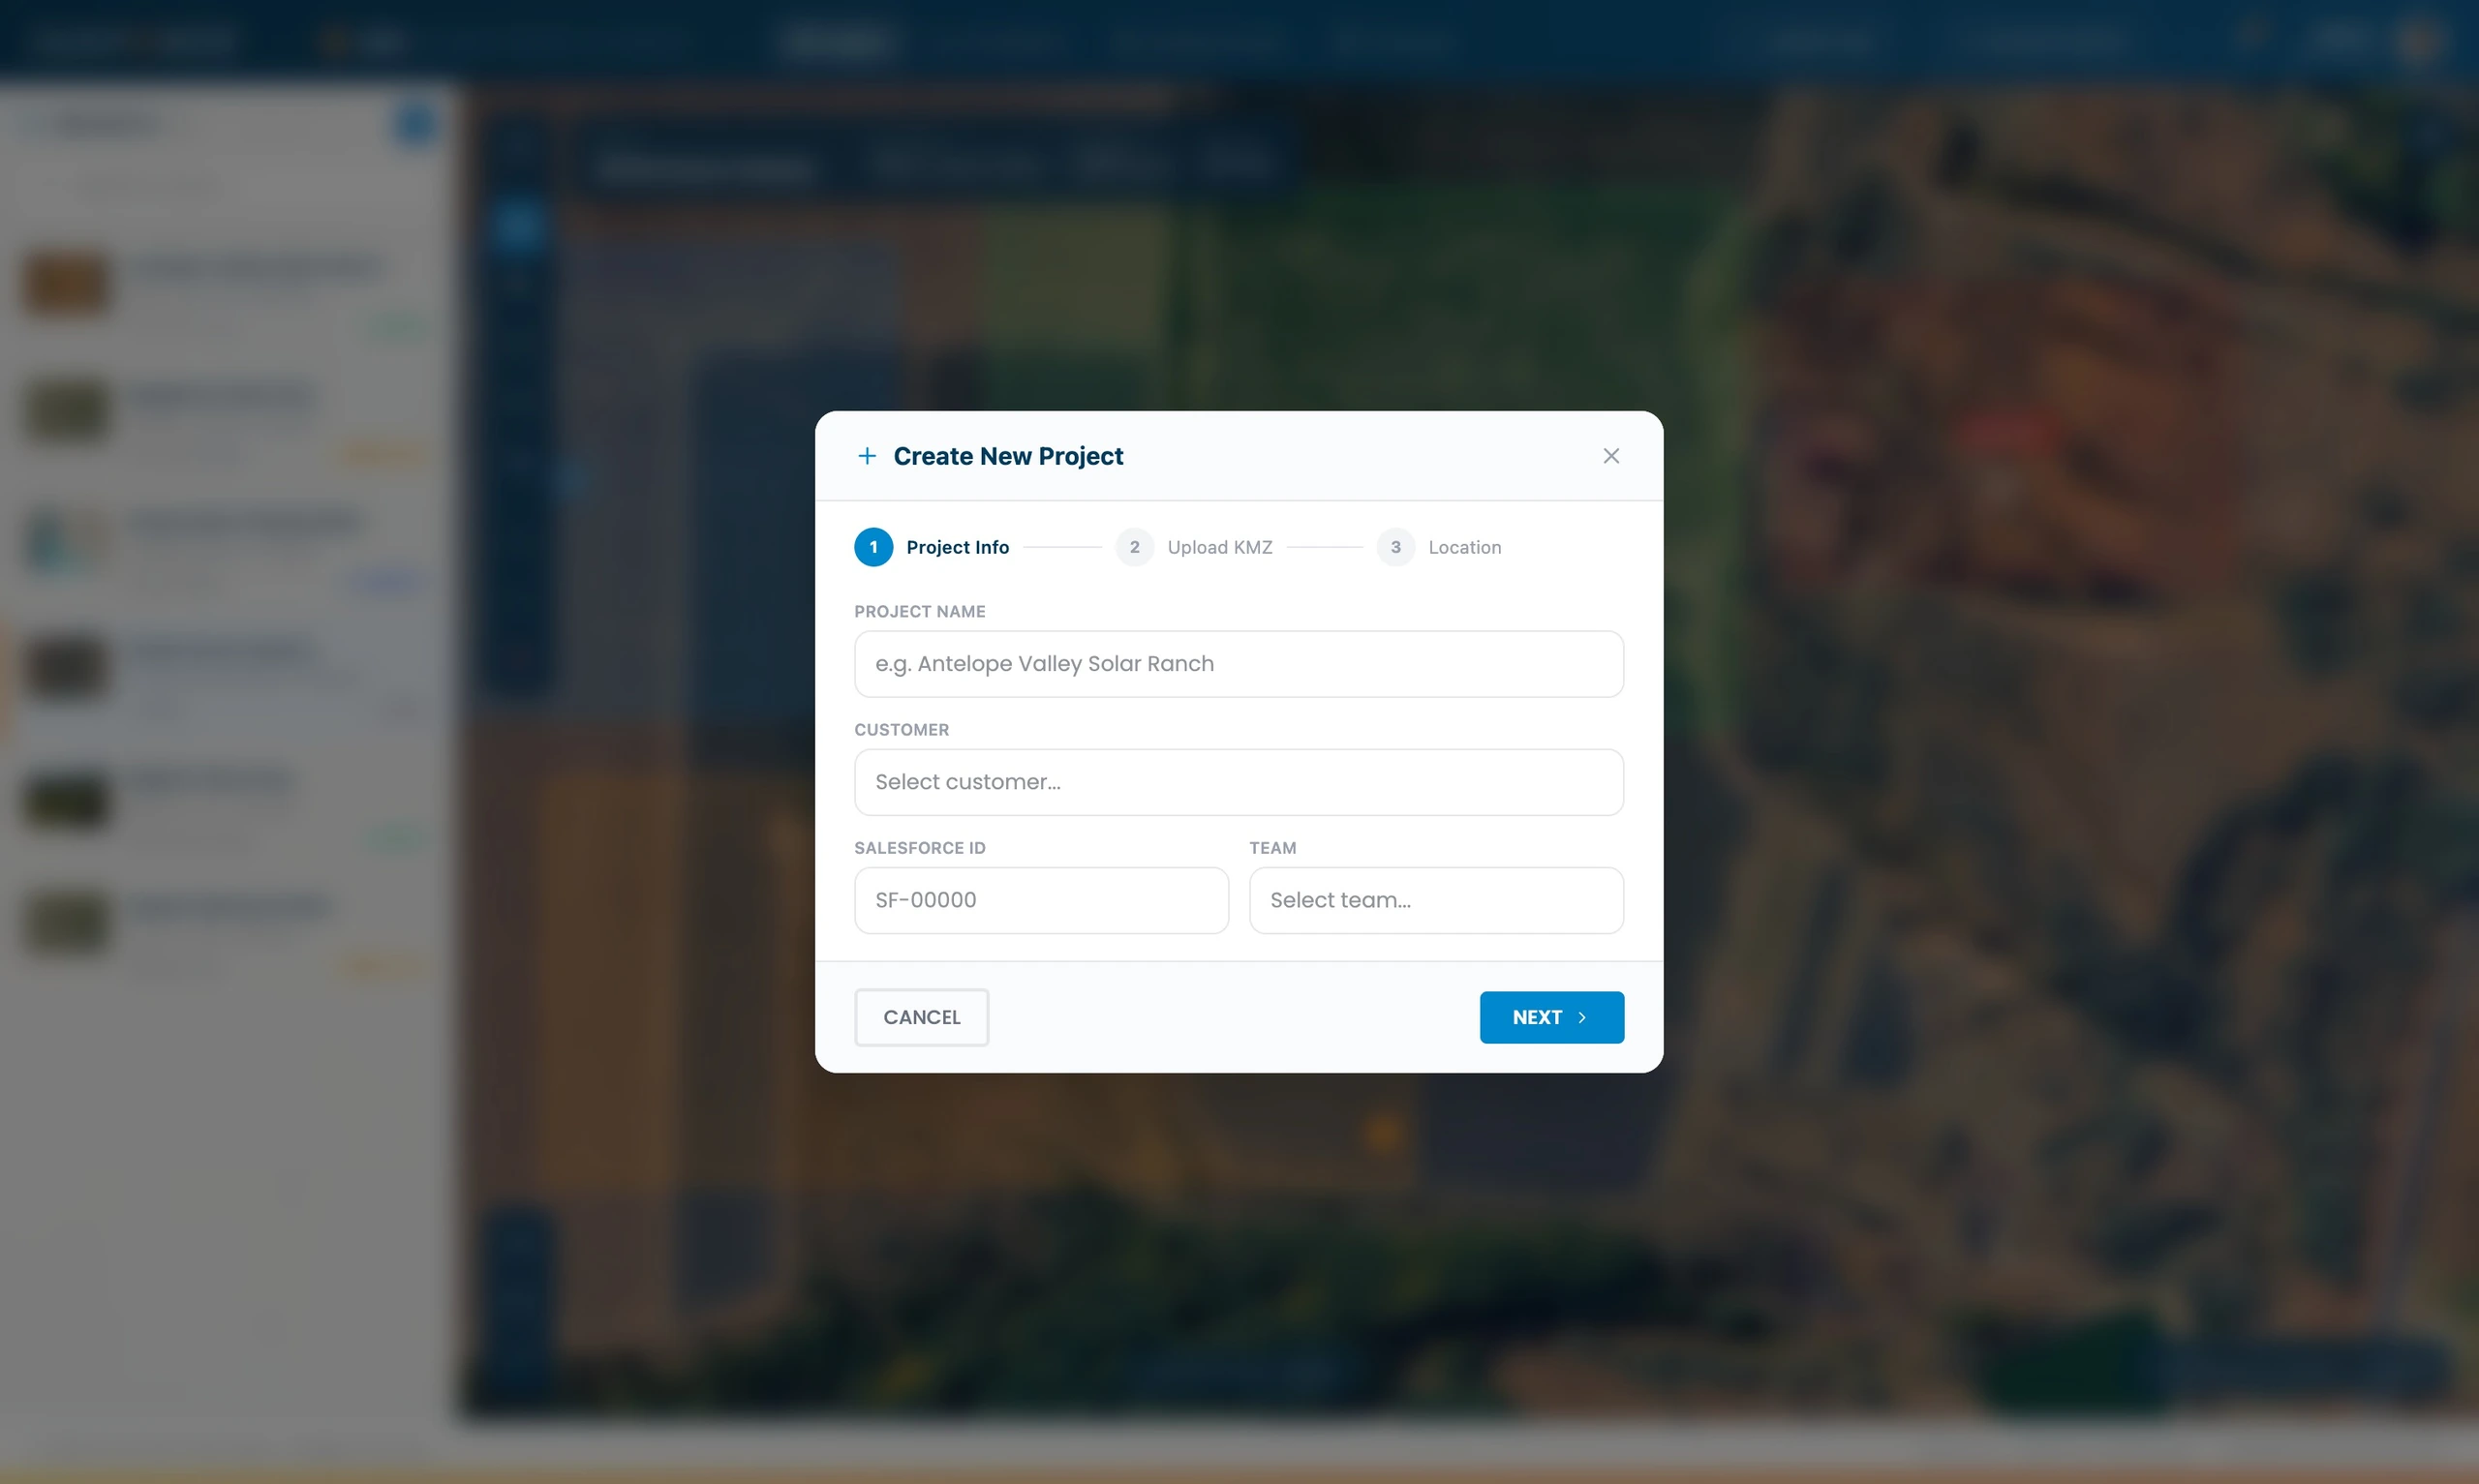
The modal captured the basic project structure, project name, customer, Salesforce ID, team, KMZ upload, and location, while keeping the map visible in the background.
That preserved context. Users were not taken away from the planning surface just to create a record.
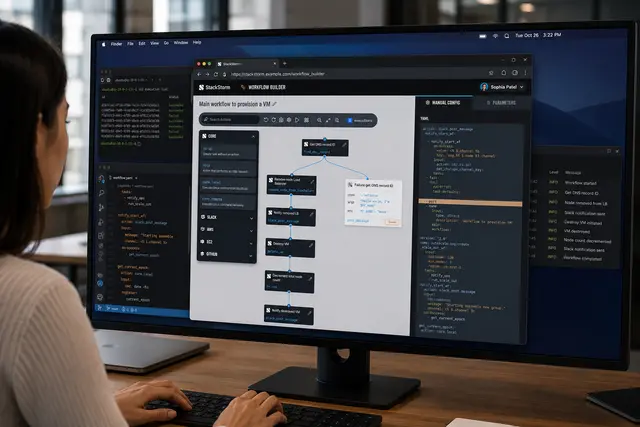
Making simulation part of the design workflow
Simulation was not treated as a separate analysis step. It was embedded into the same map-based workflow.
The simulation controls let users adjust product type, ground coverage ratio, DC/AC ratio, and other key assumptions before running analysis.
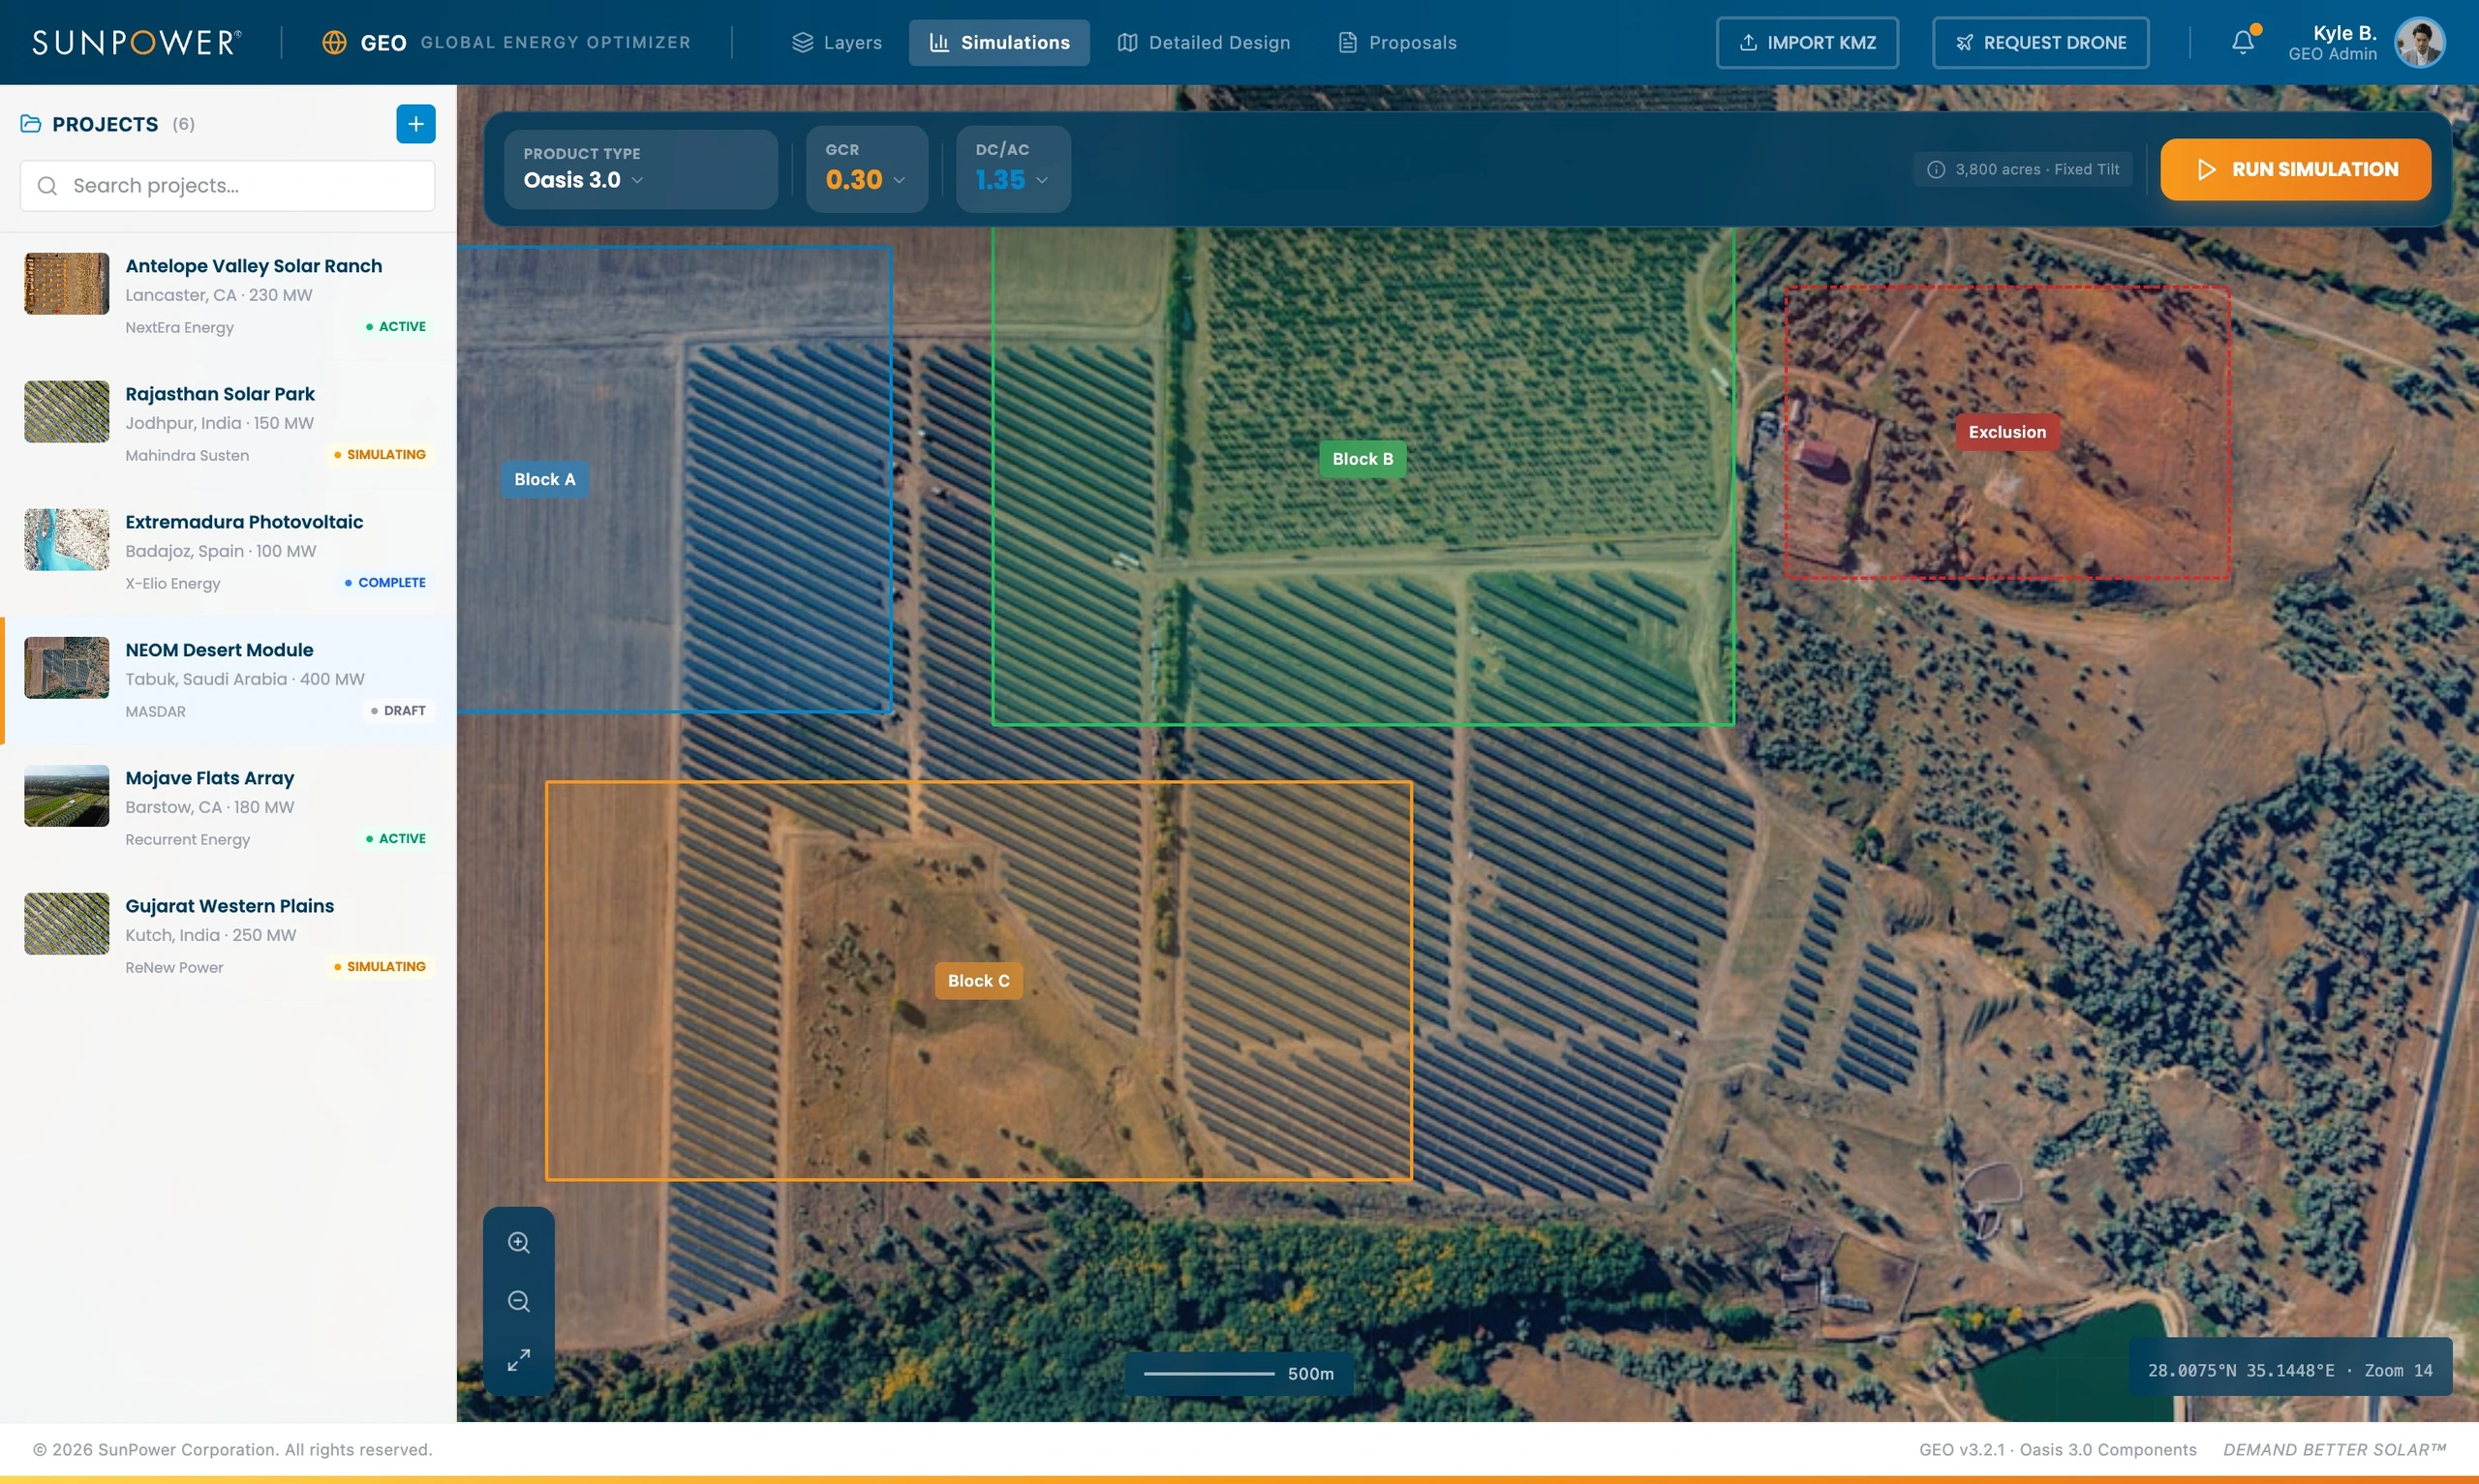
Product selection allowed teams to compare tracker and system options without leaving the site context.
Parameter tuning gave the workflow a more exploratory feel. Users could adjust assumptions and immediately understand that the design was not fixed. It was a model to be tested.
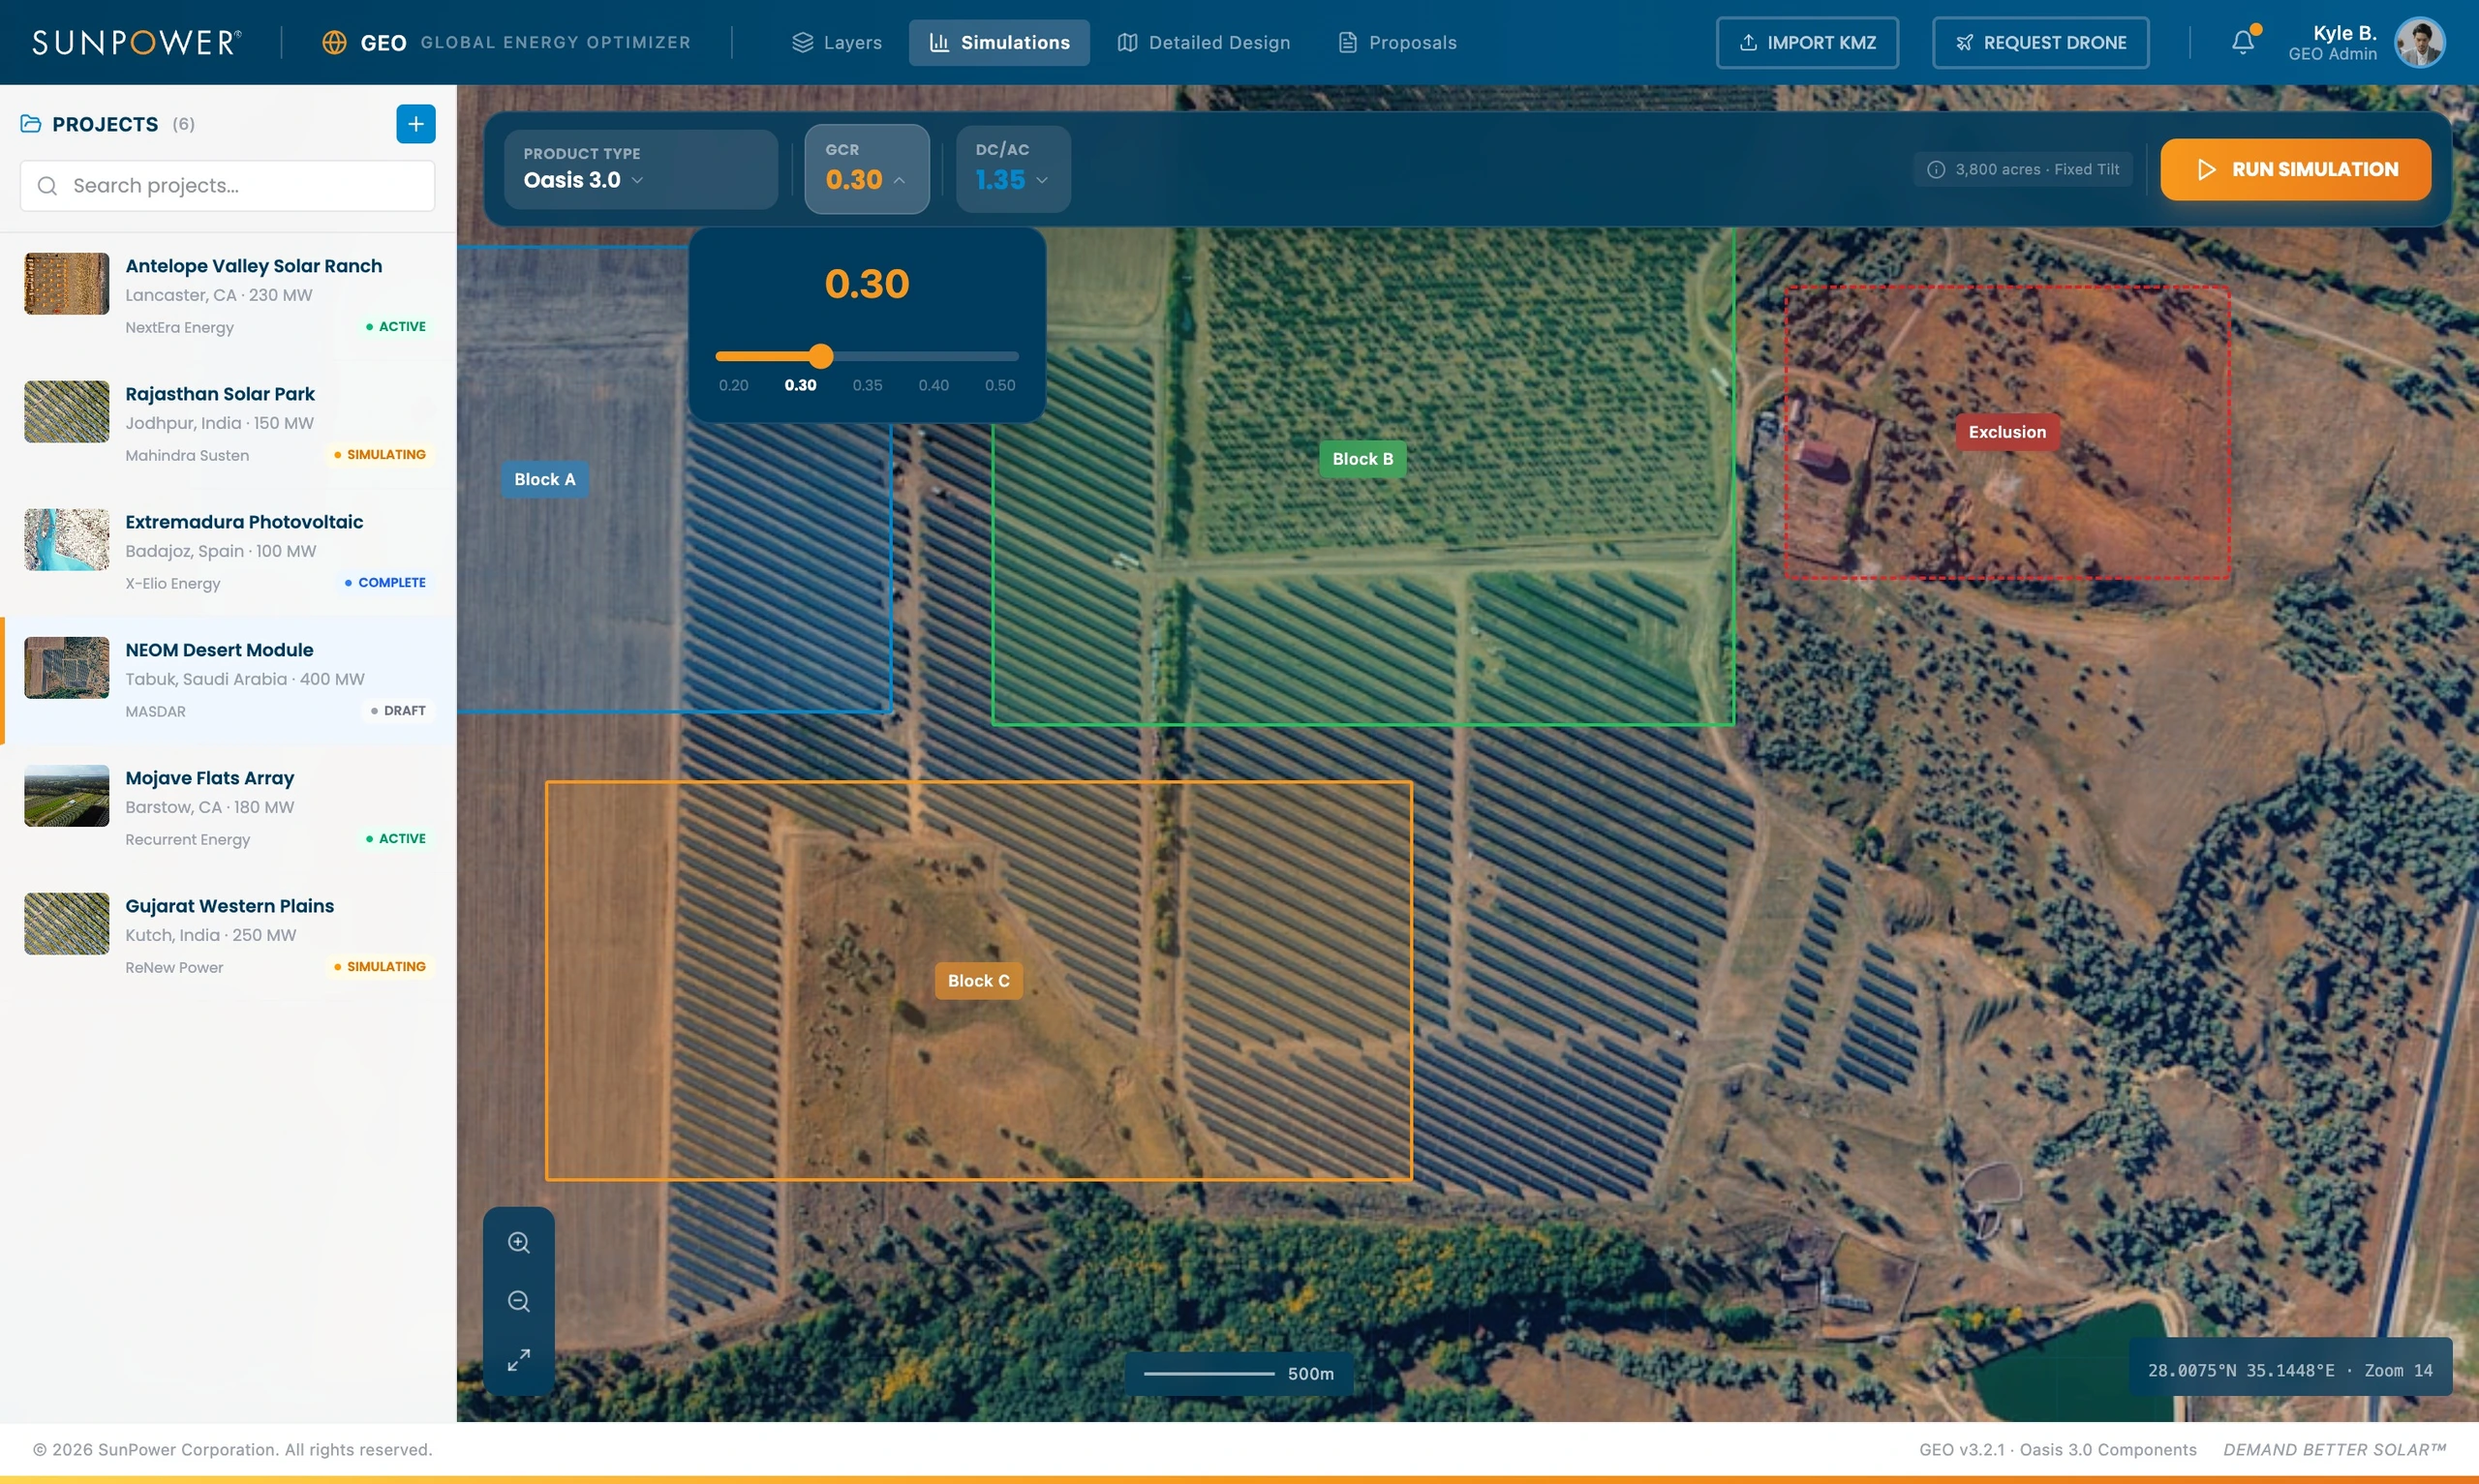
The interface had to make this complexity manageable. Too much engineering detail would slow the user down. Too little would make the output feel untrustworthy.
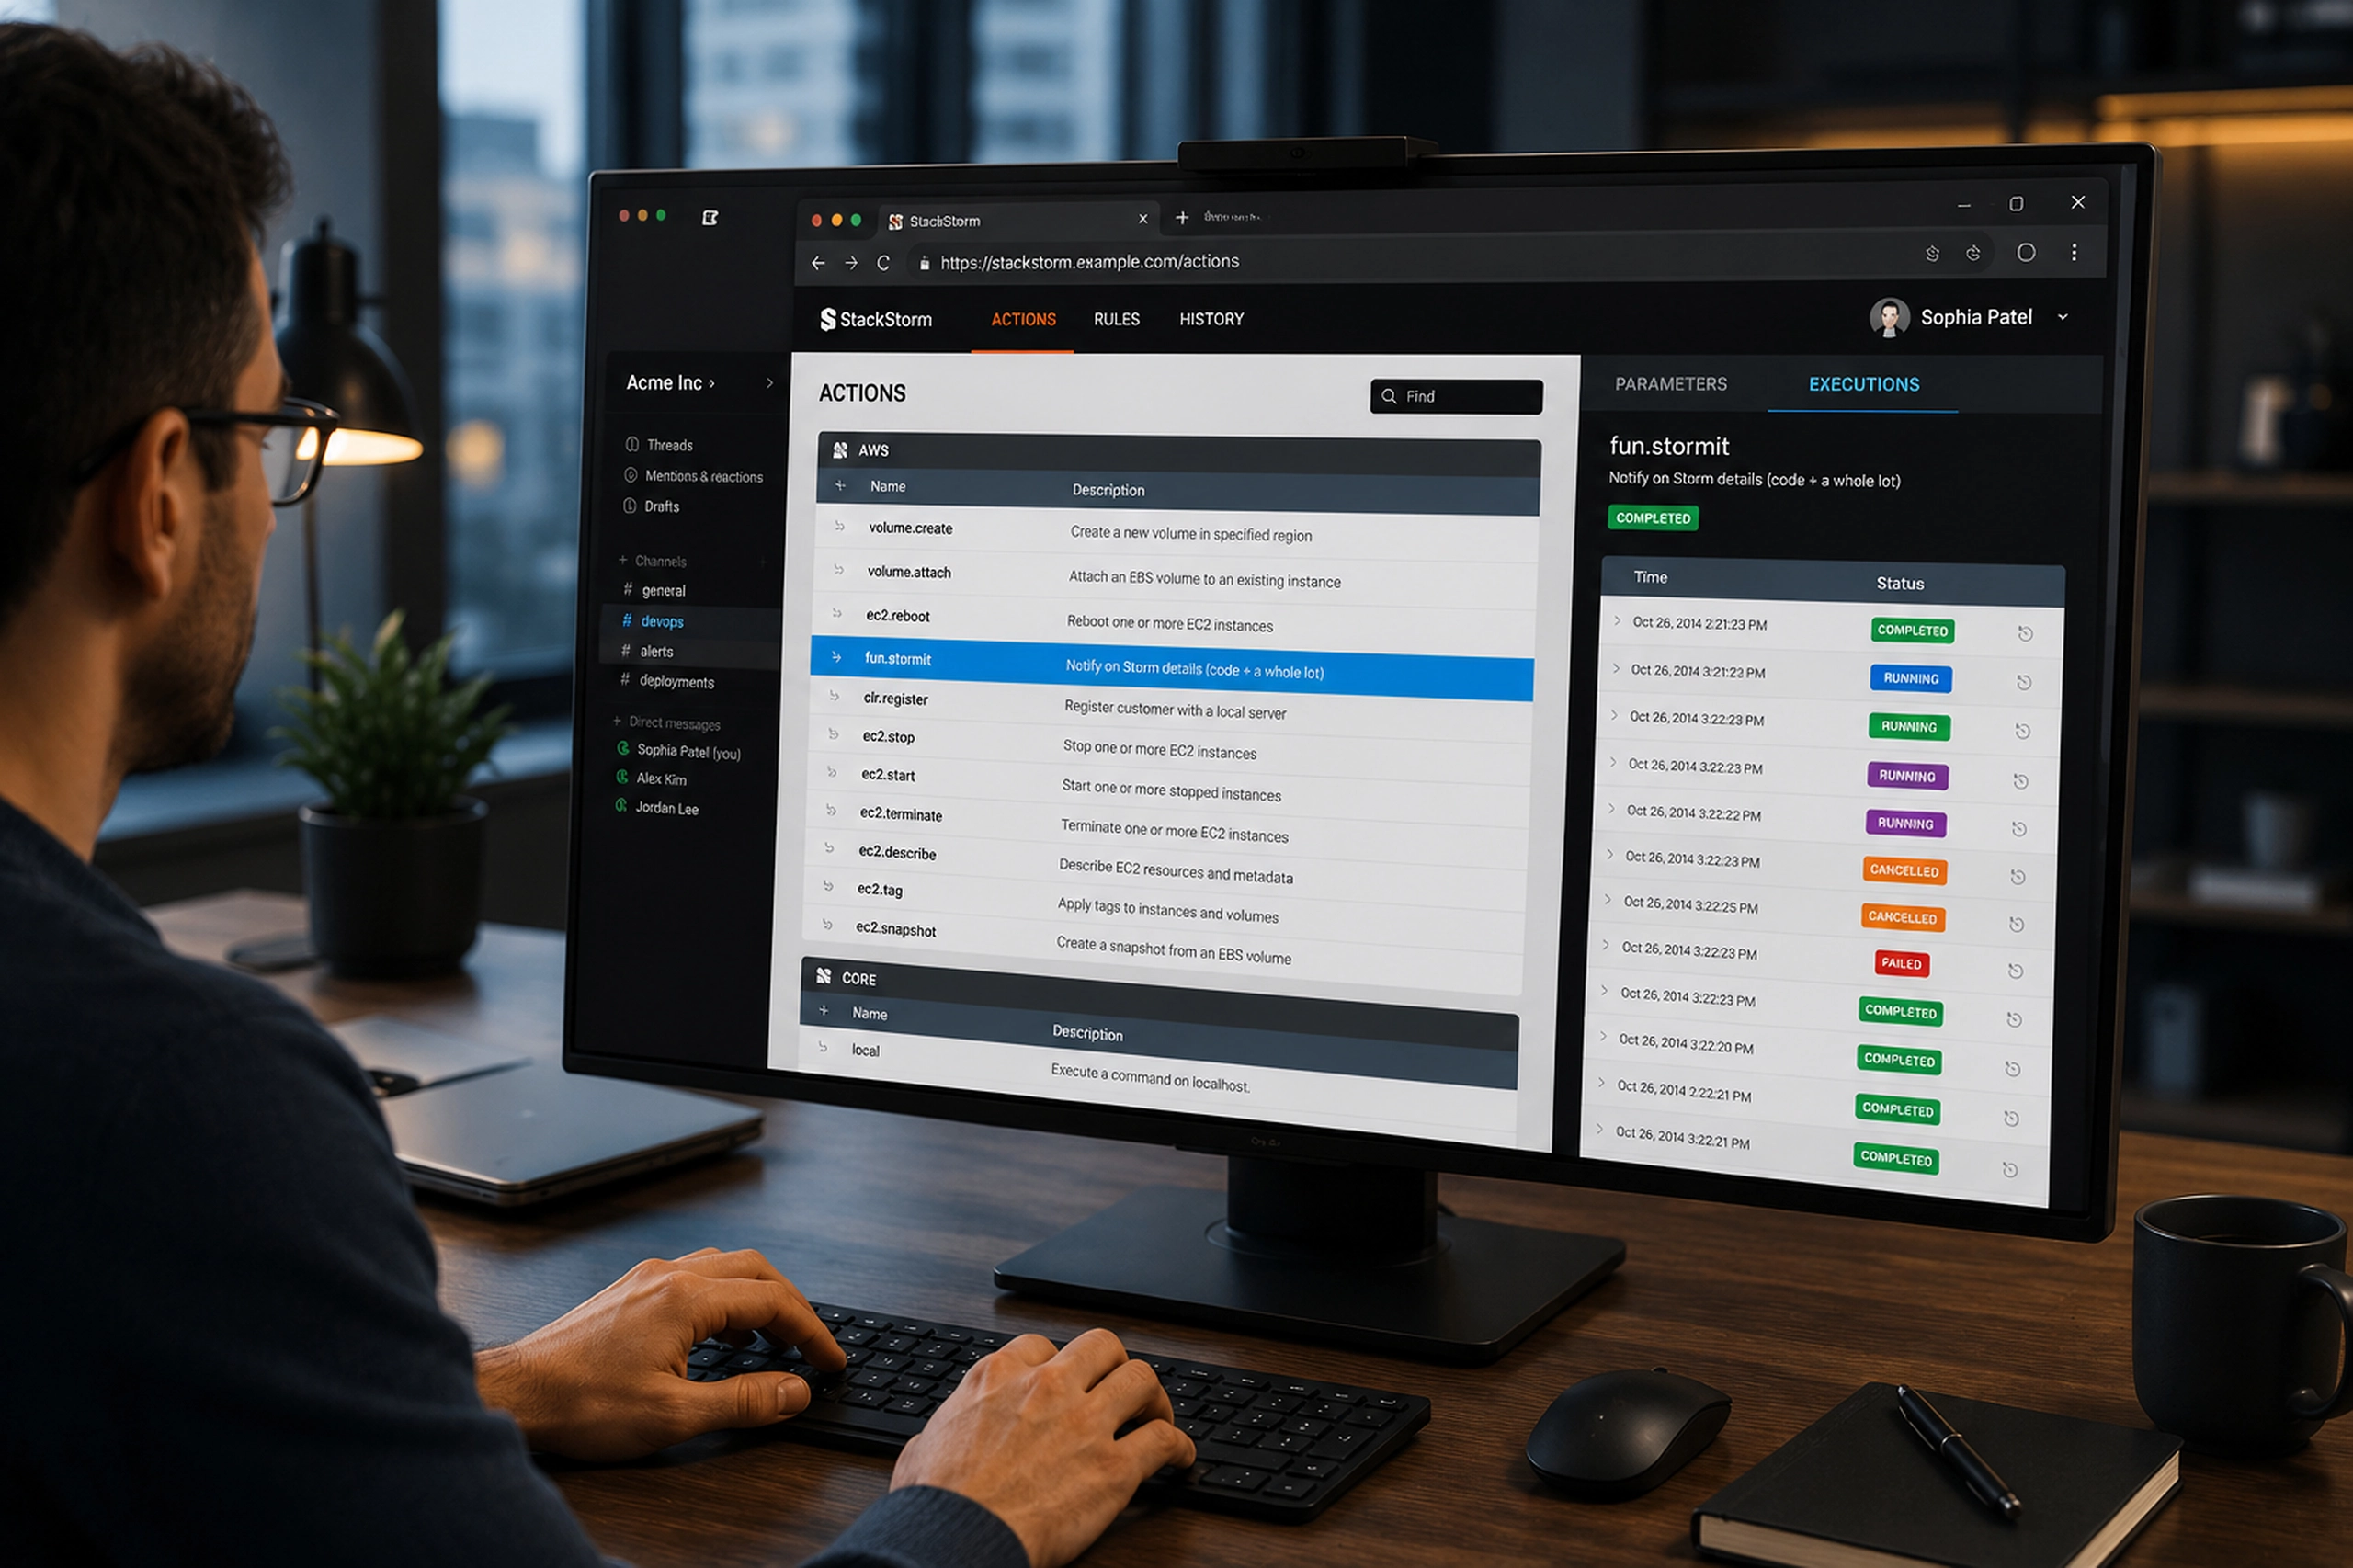
Showing progress while analysis ran
Simulation can feel opaque when the user has no feedback. GEO used a progress state to make the system’s work visible.
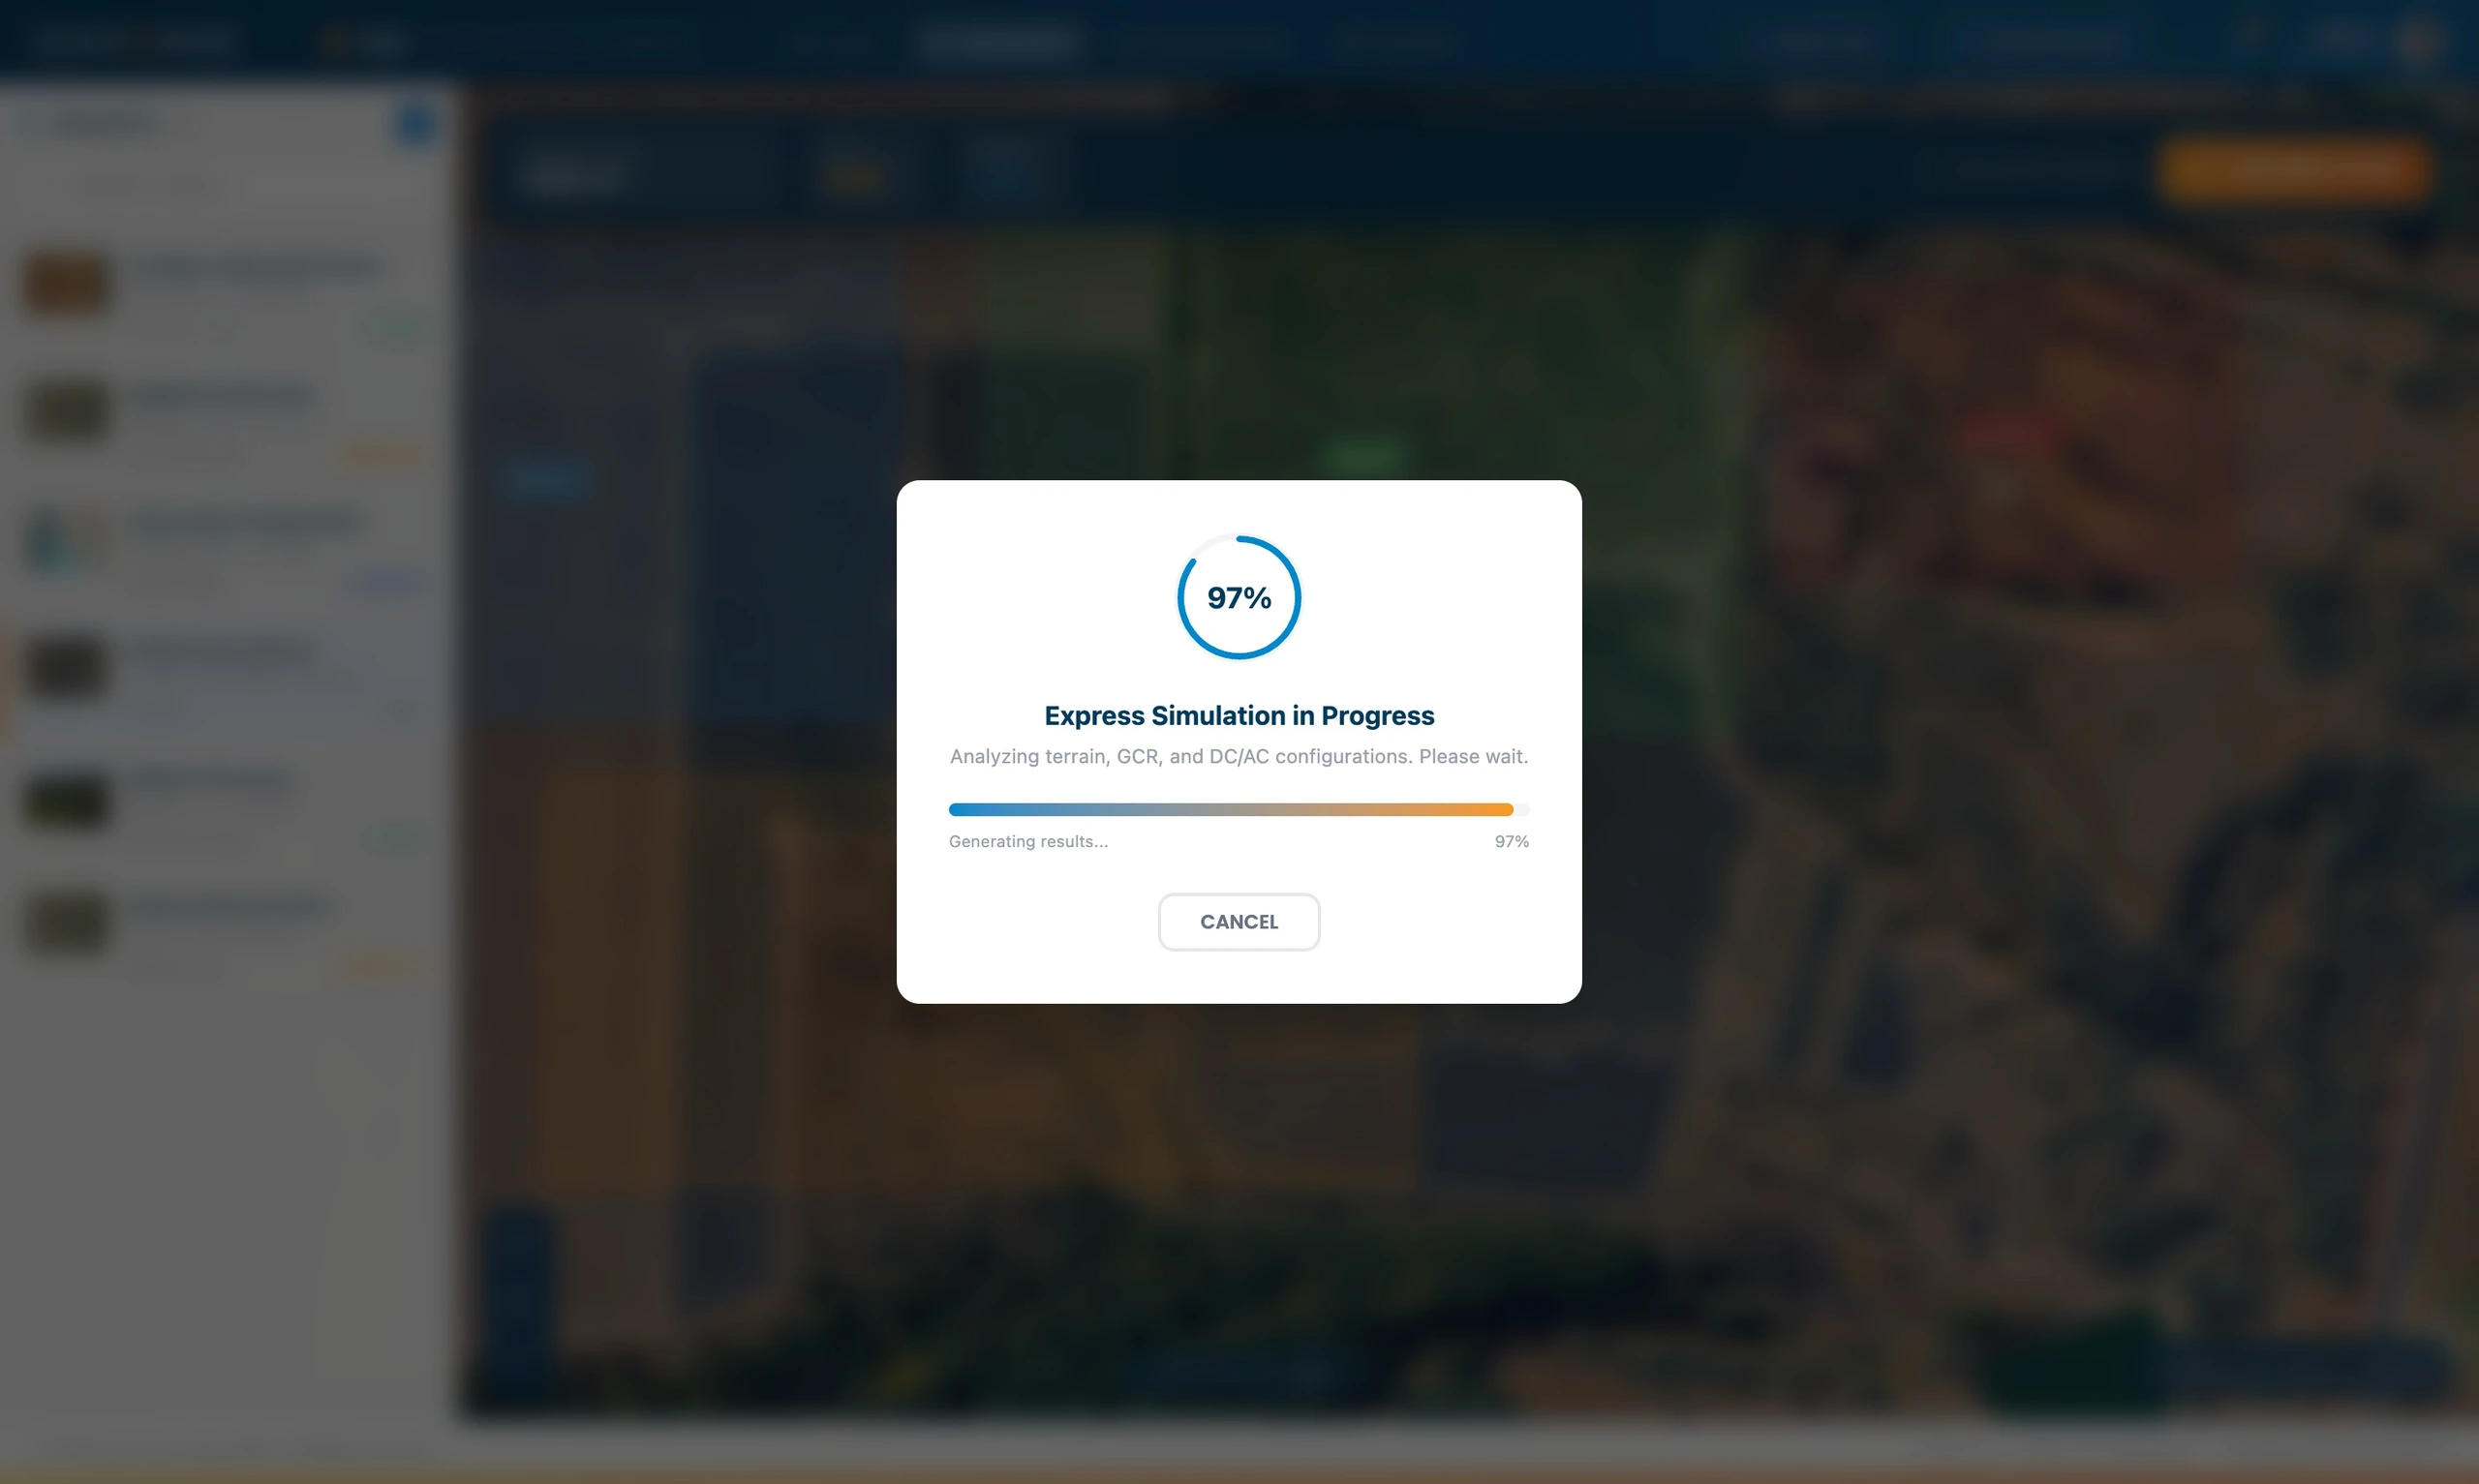
This kind of interaction matters in technical tools. When analysis takes time, the interface needs to reassure the user that something real is happening and that the system is processing the selected assumptions.
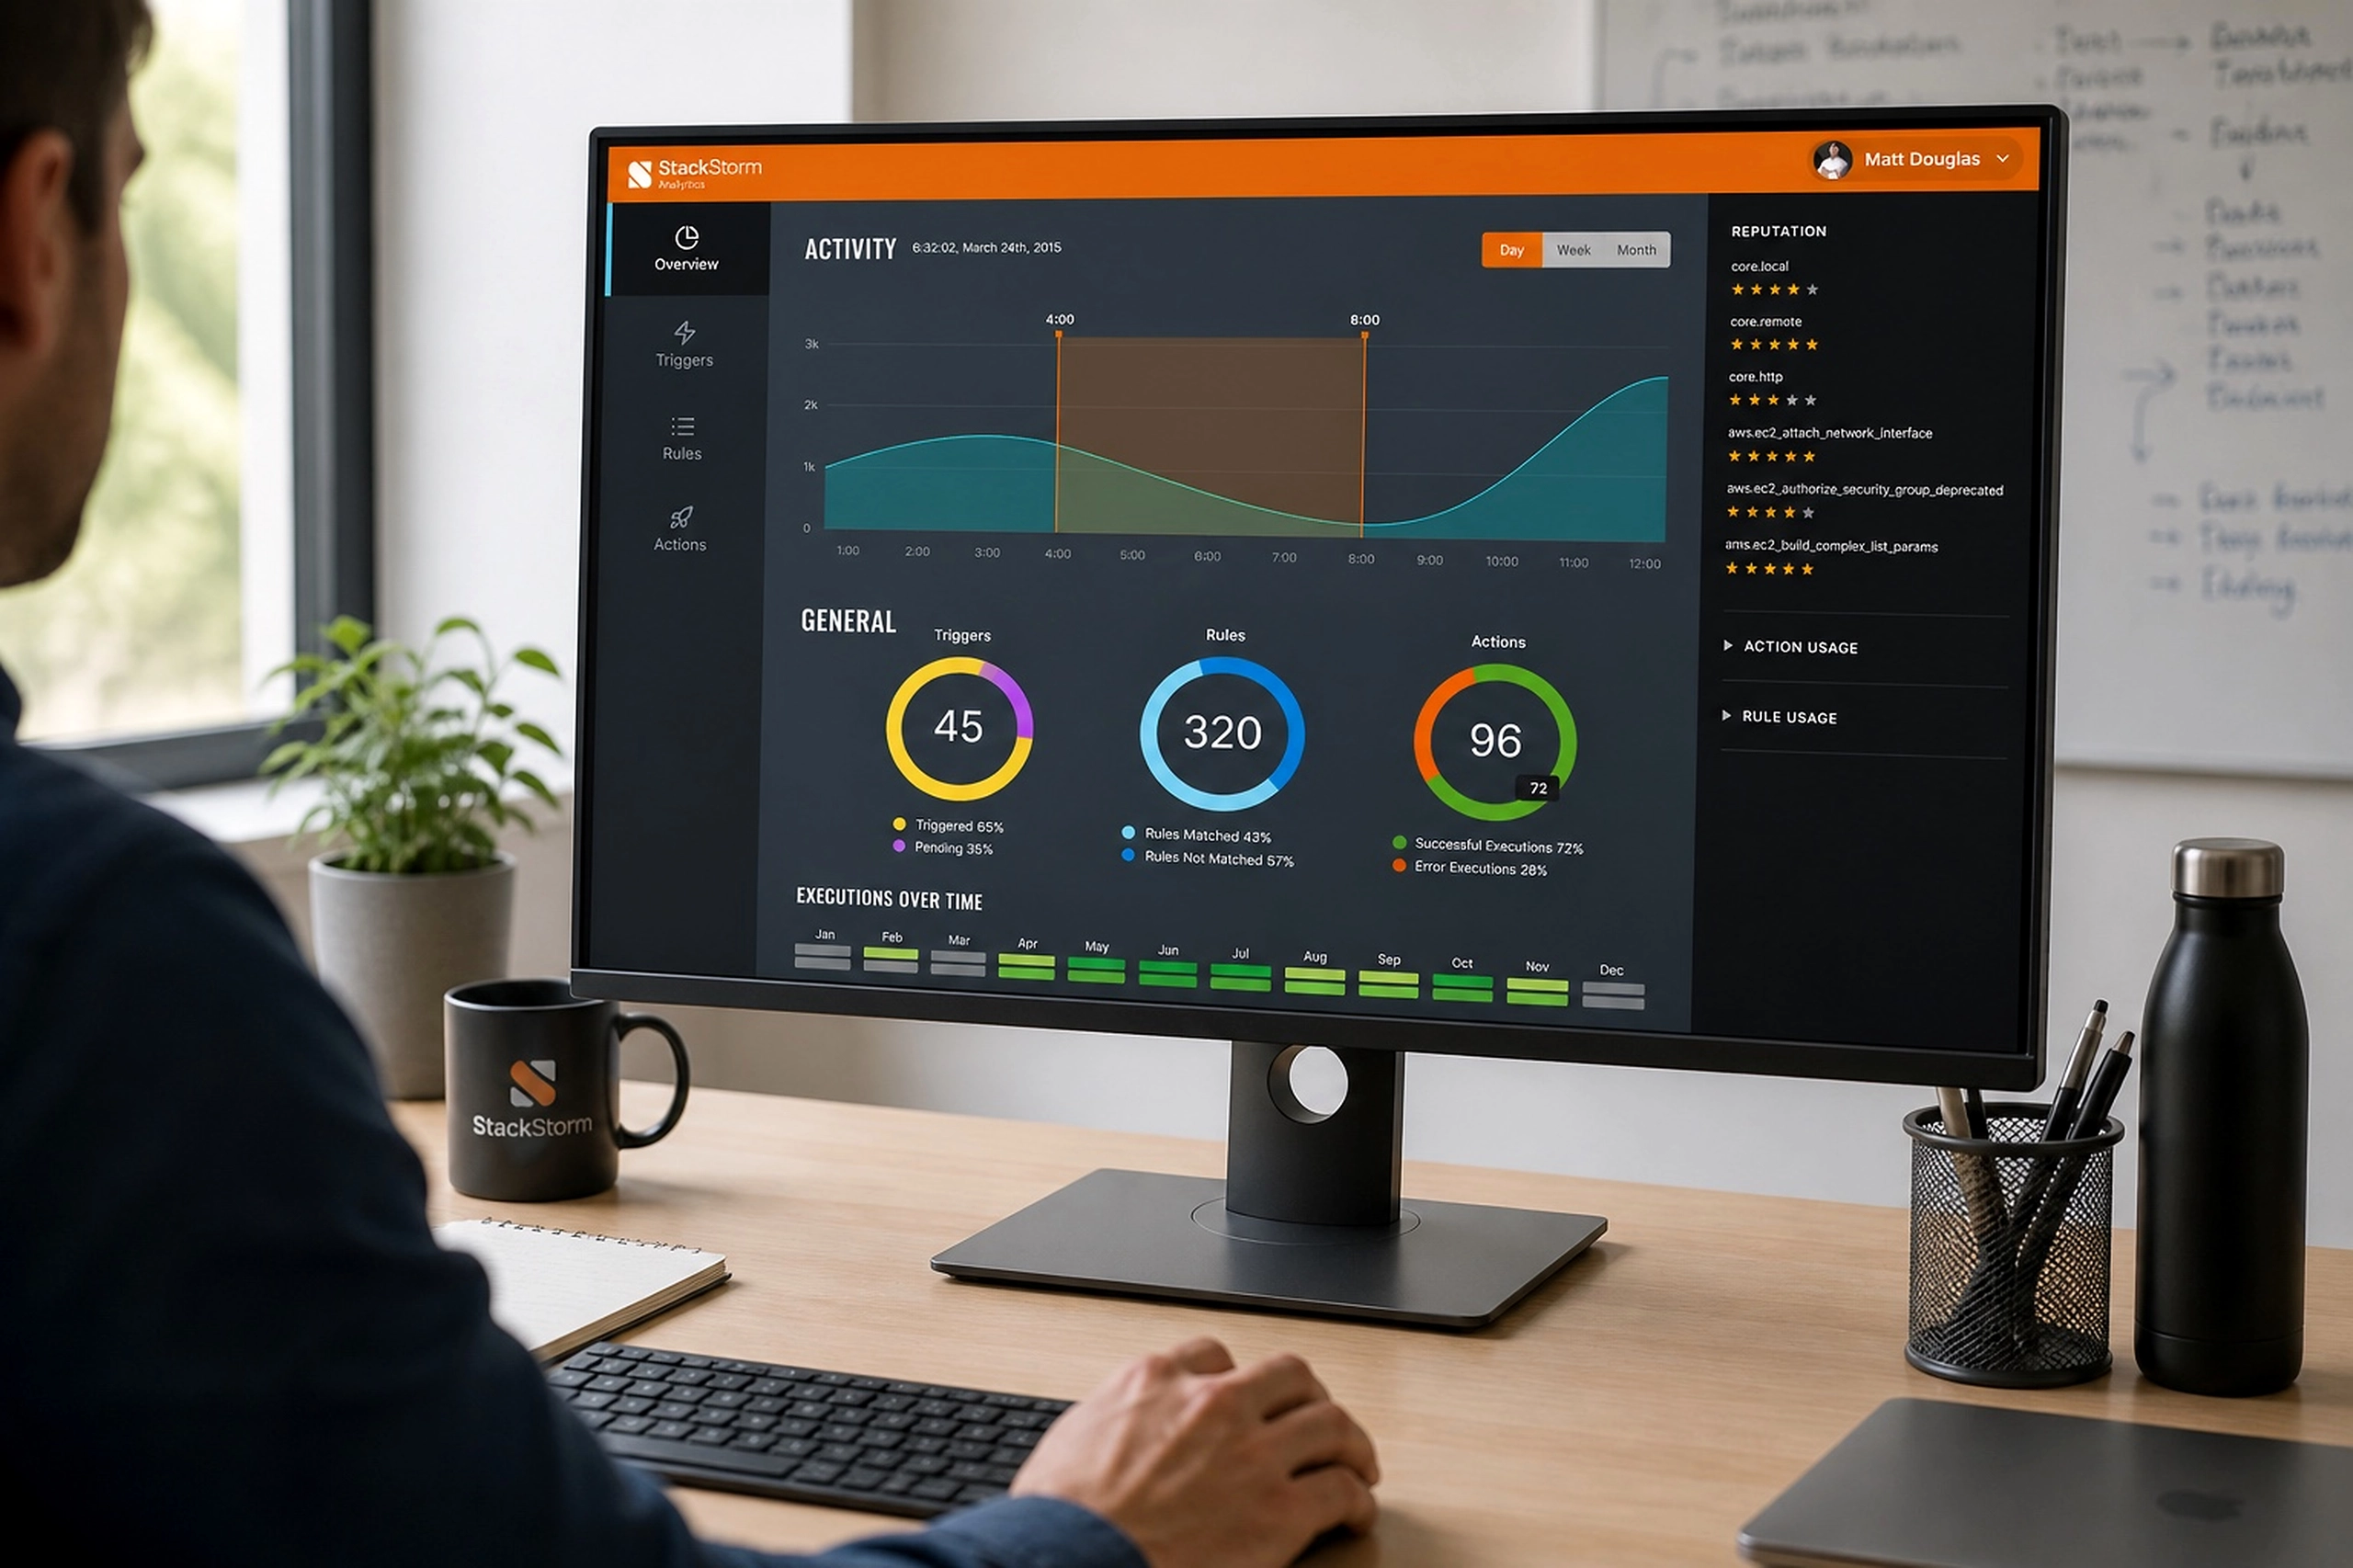
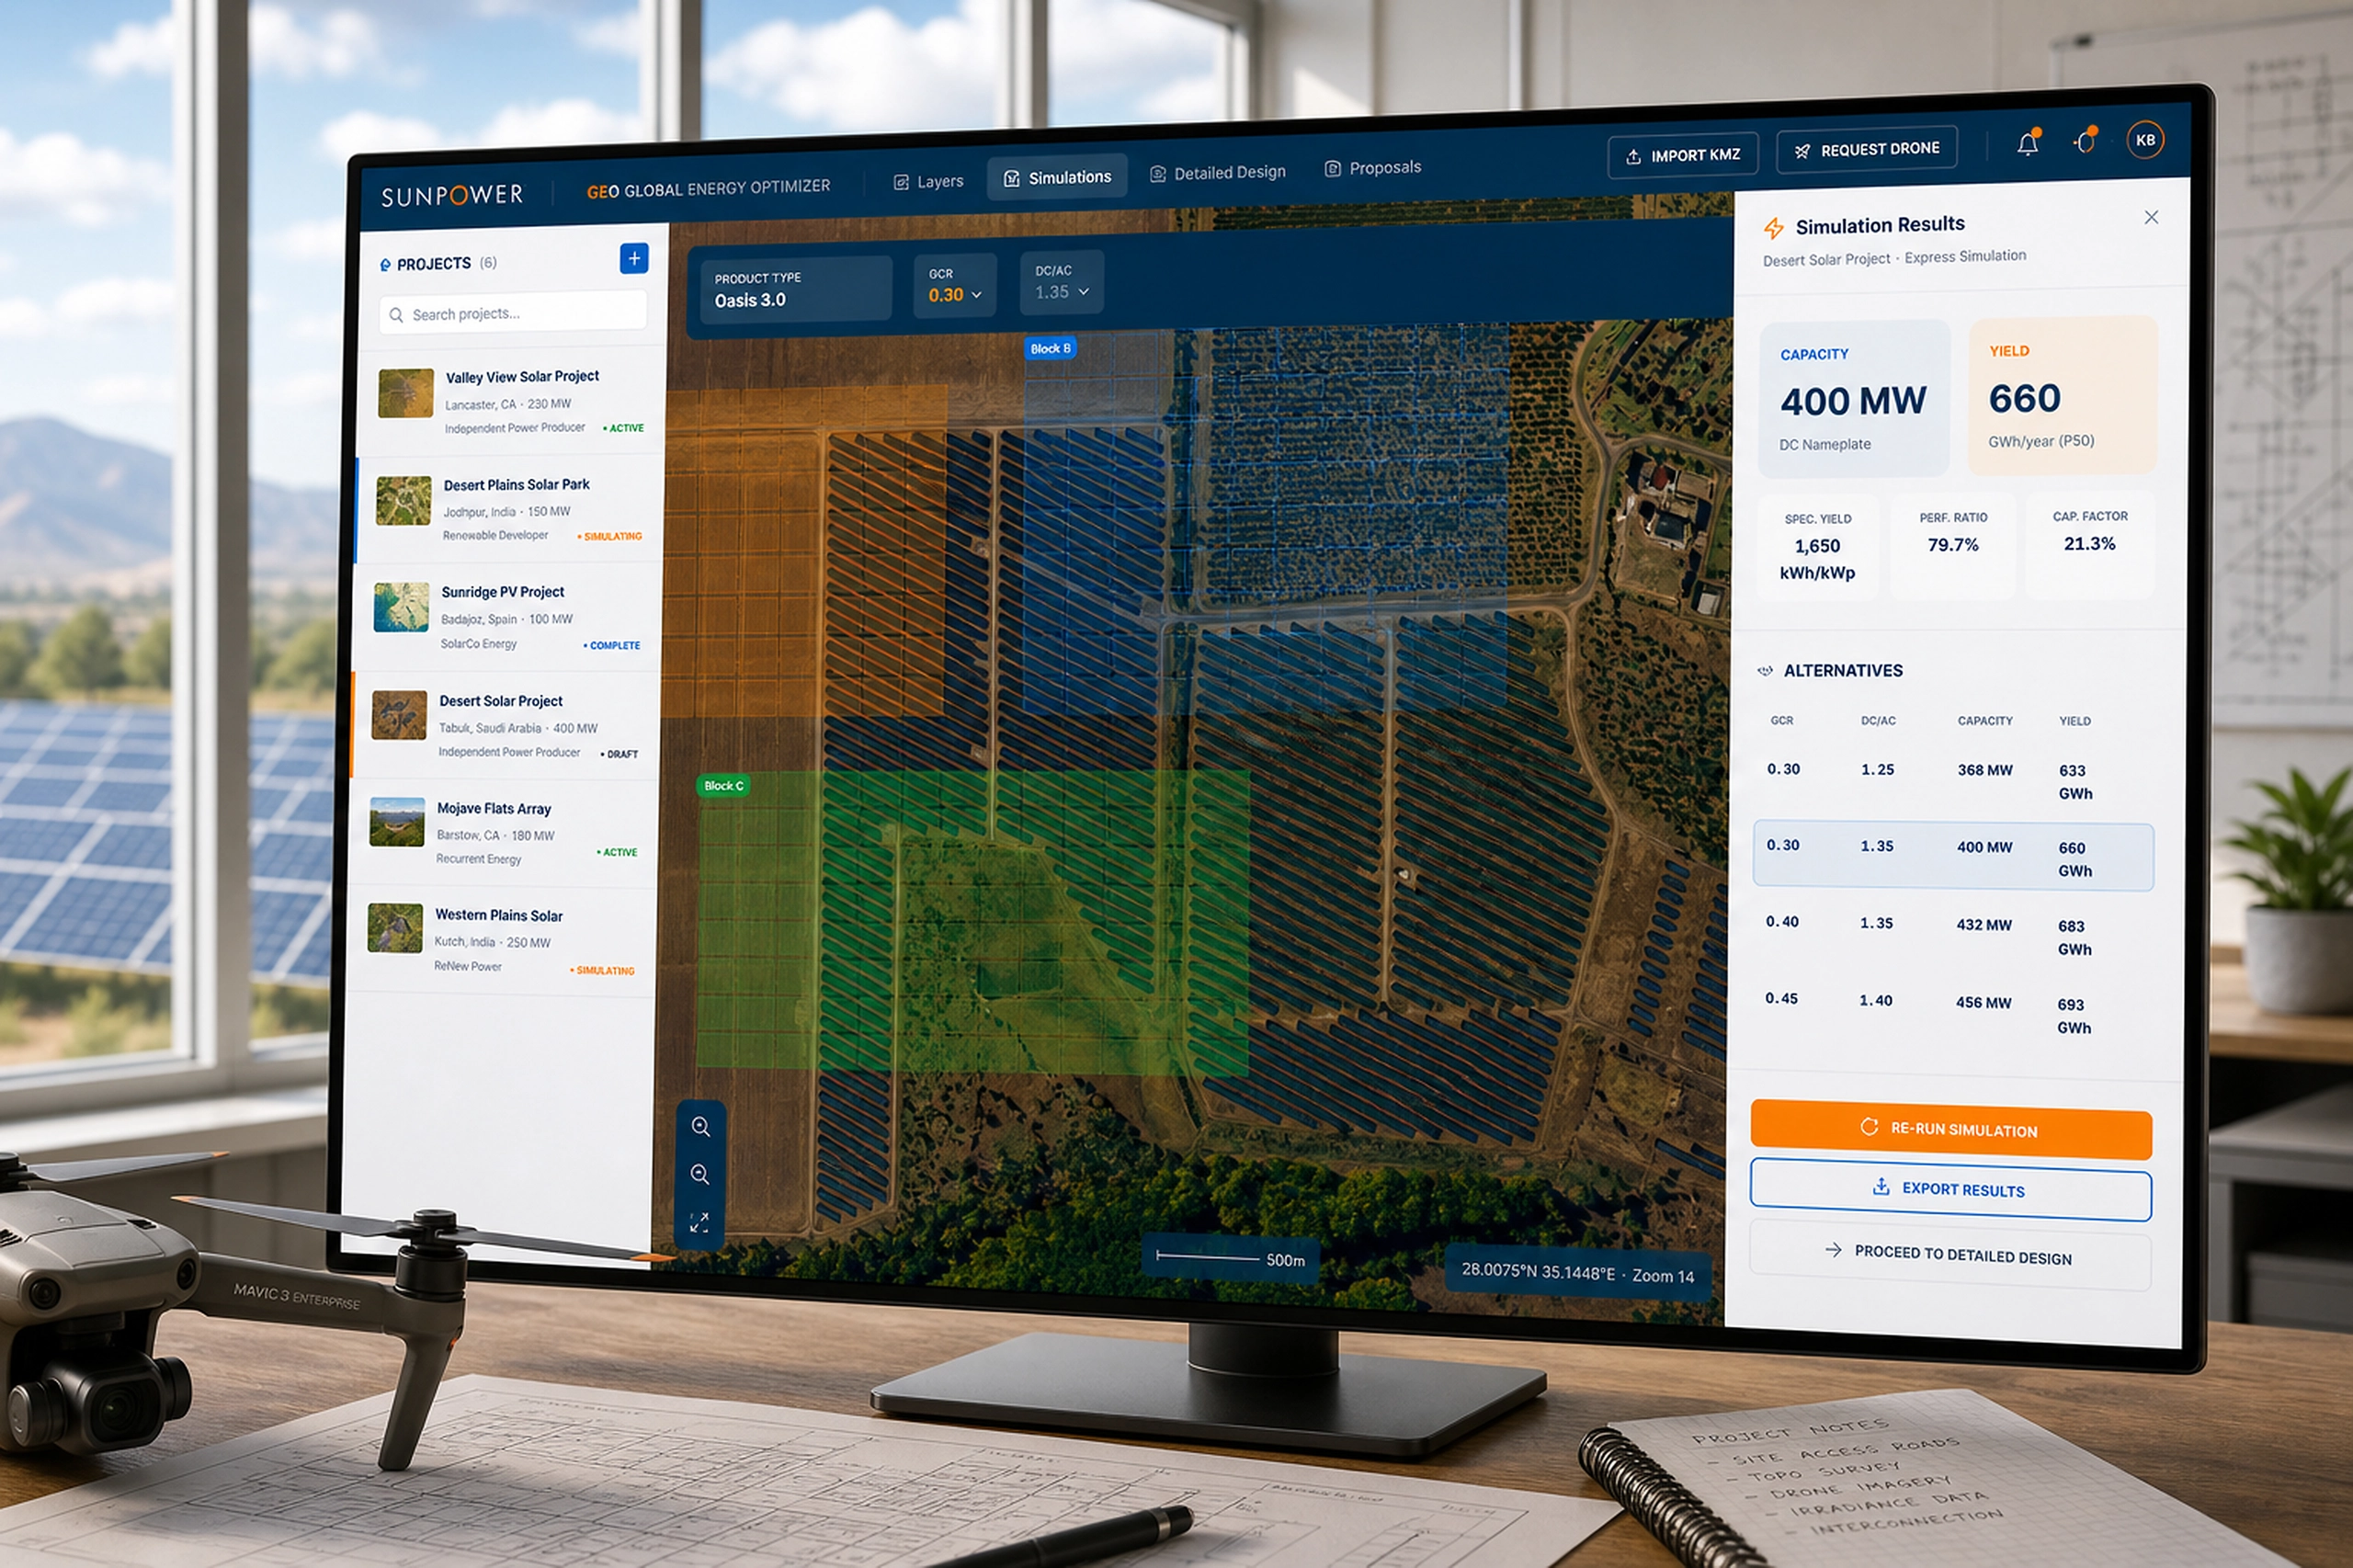
Comparing results instead of forcing one answer
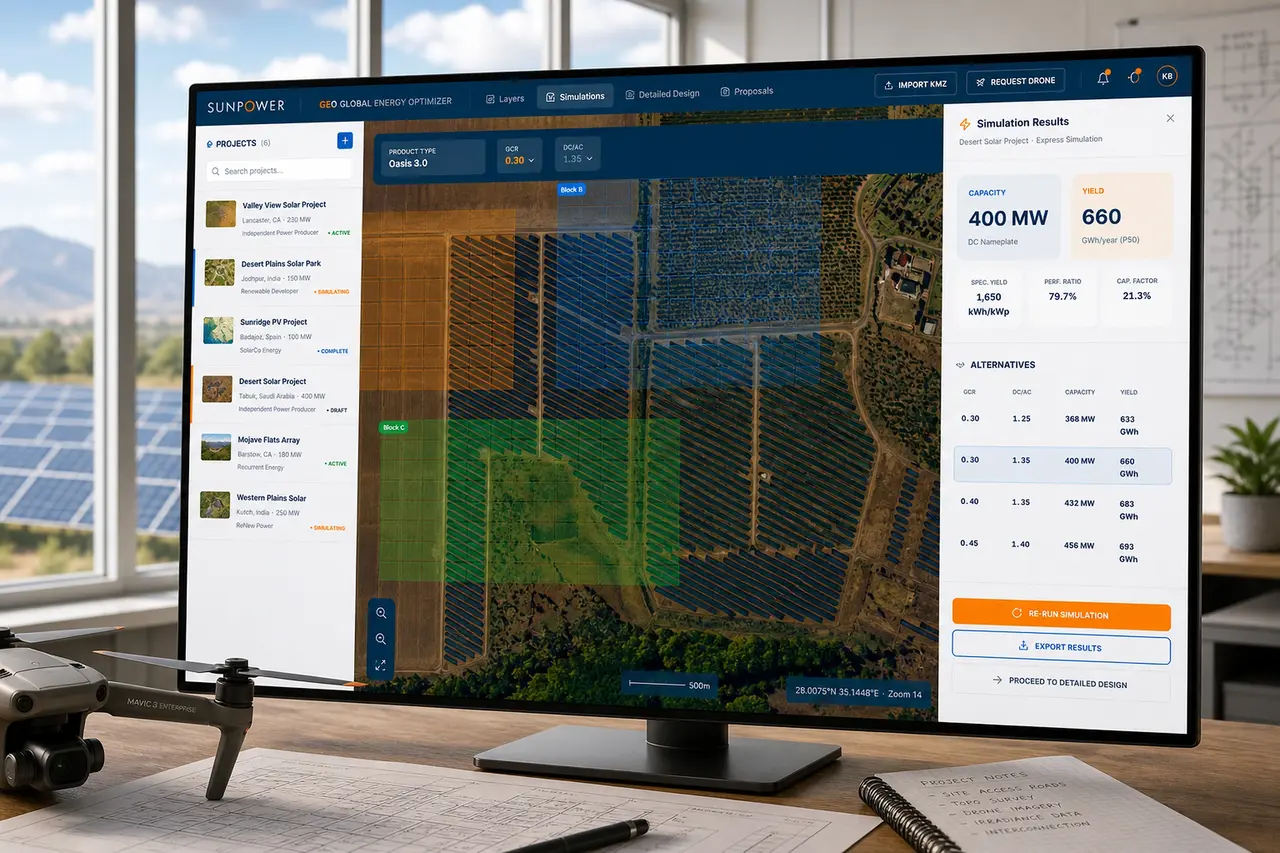
The simulation results view translated analysis into decision-ready comparisons: capacity, yield, specific yield, performance ratio, capacity factor, and alternative configurations.
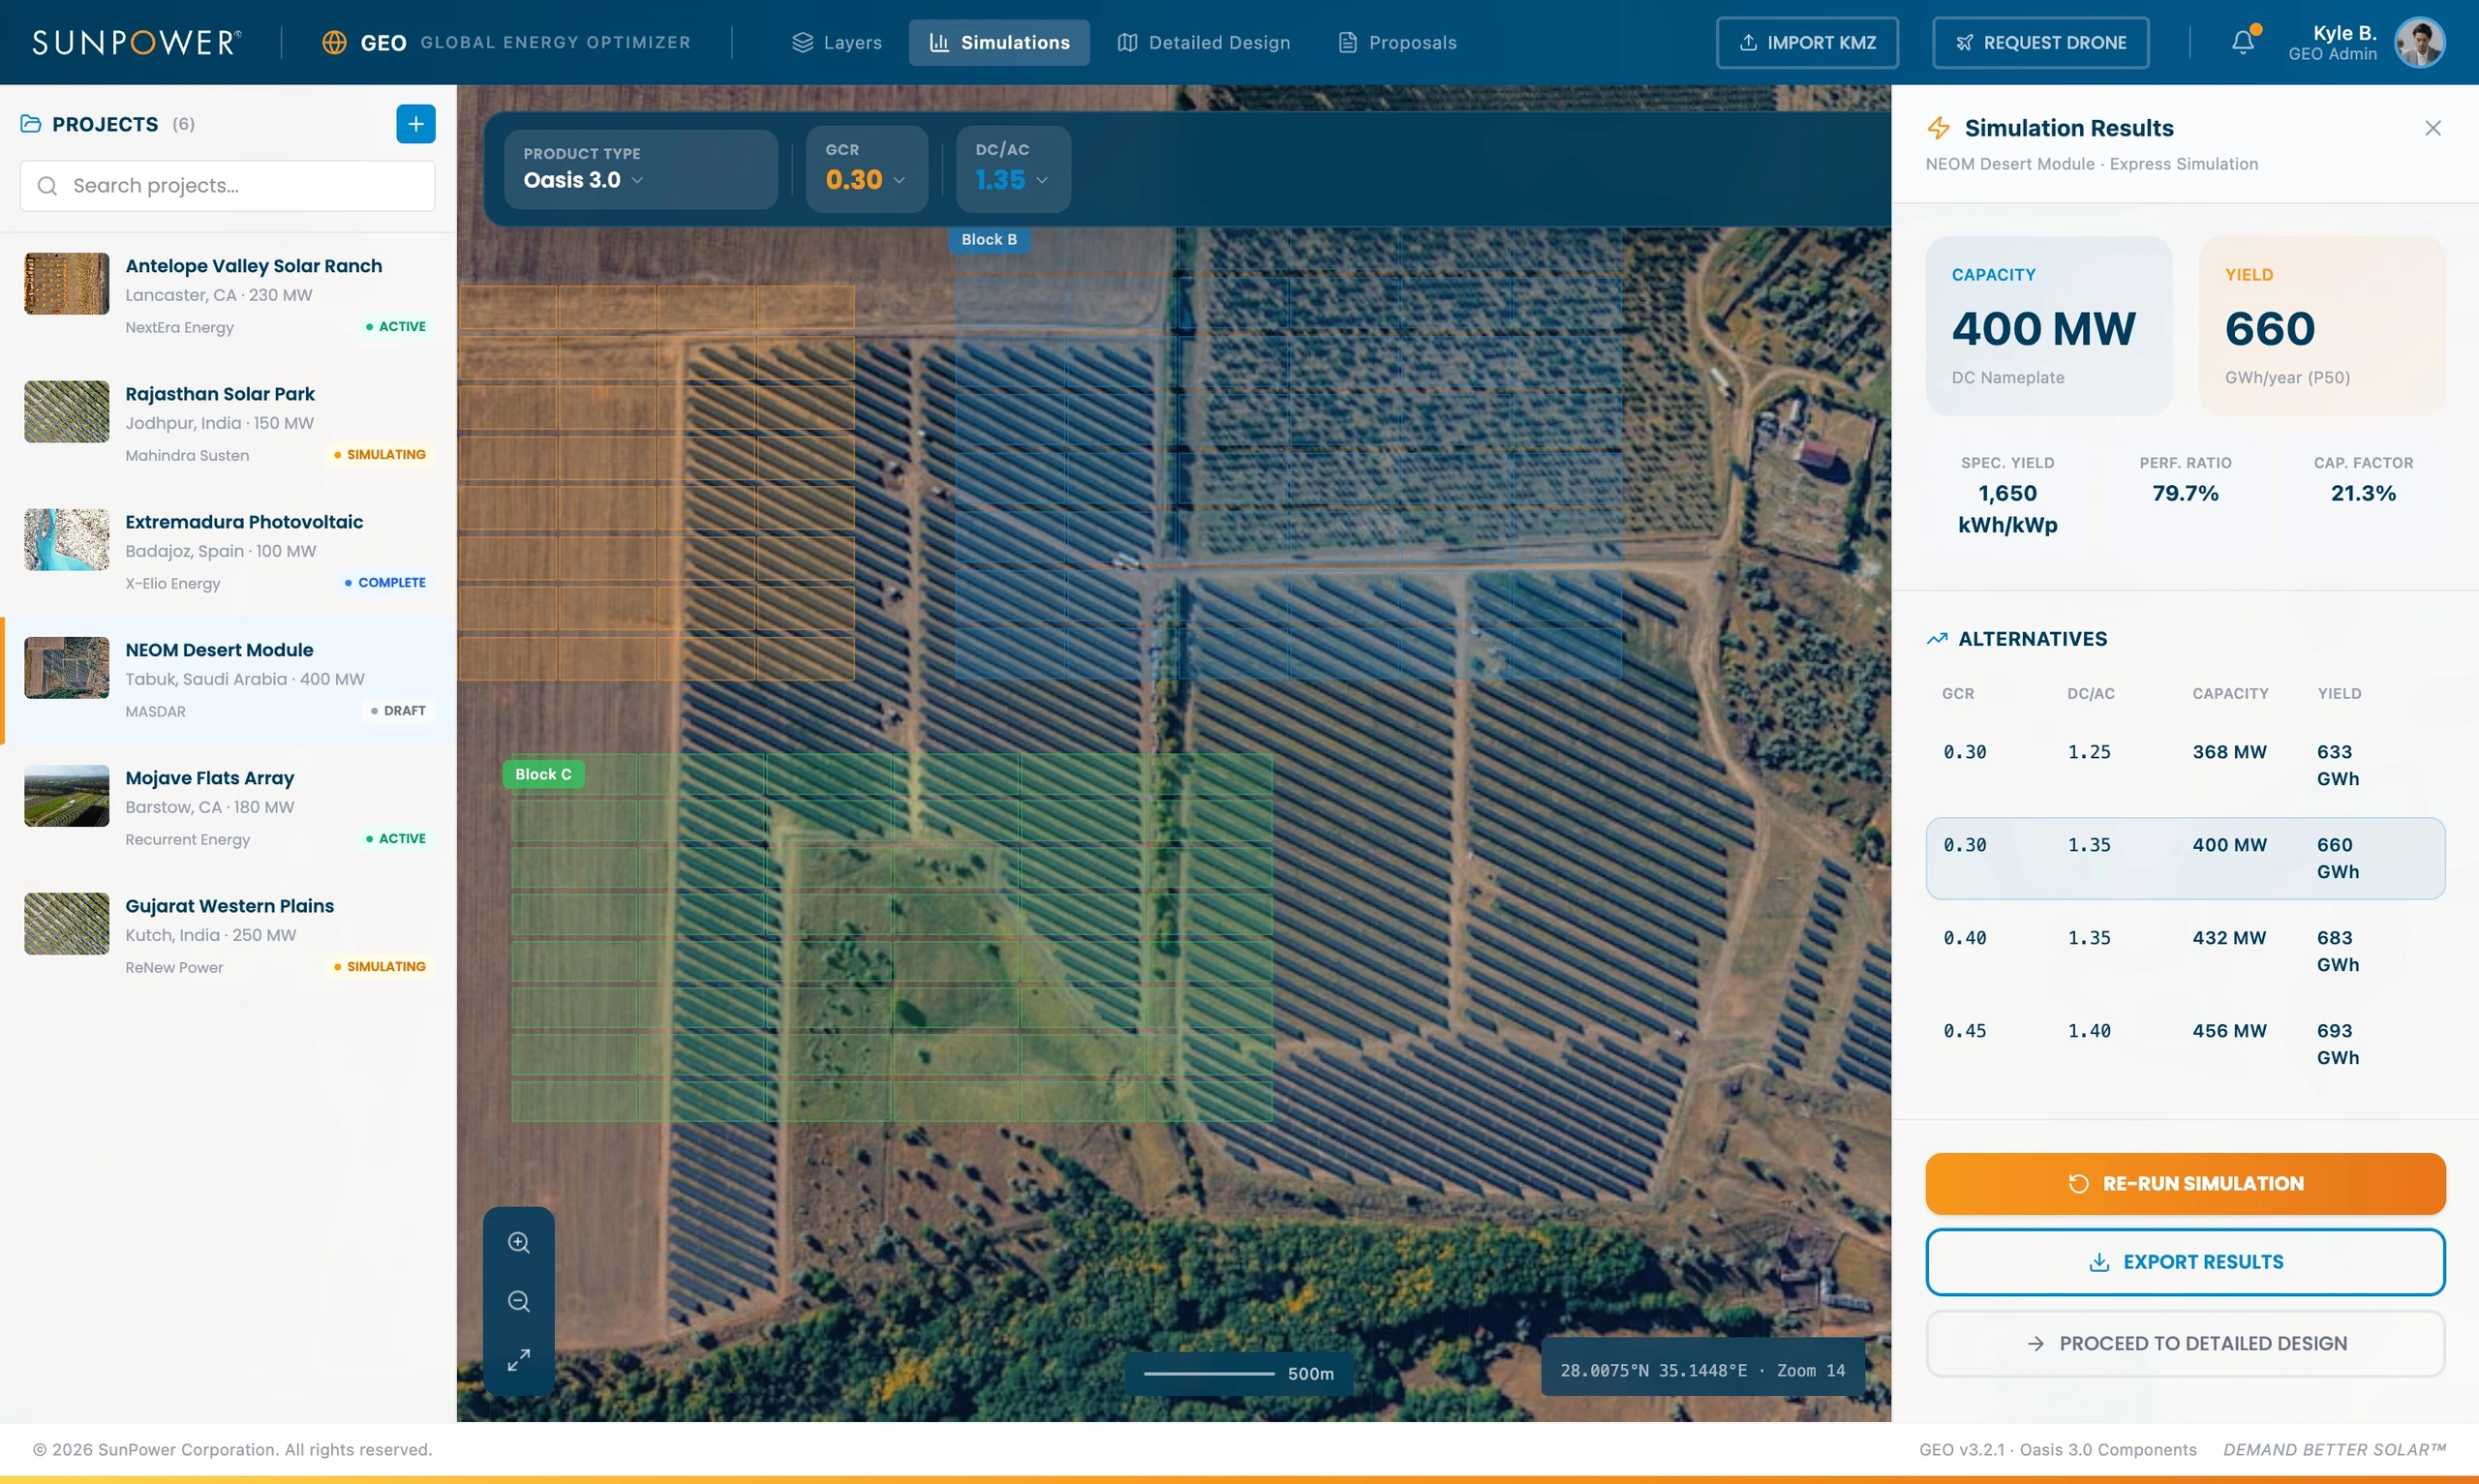
This let teams move from “run a simulation” to “compare tradeoffs.” The product surfaced alternatives so users could reason through density, capacity, performance, and production instead of accepting a single opaque recommendation.
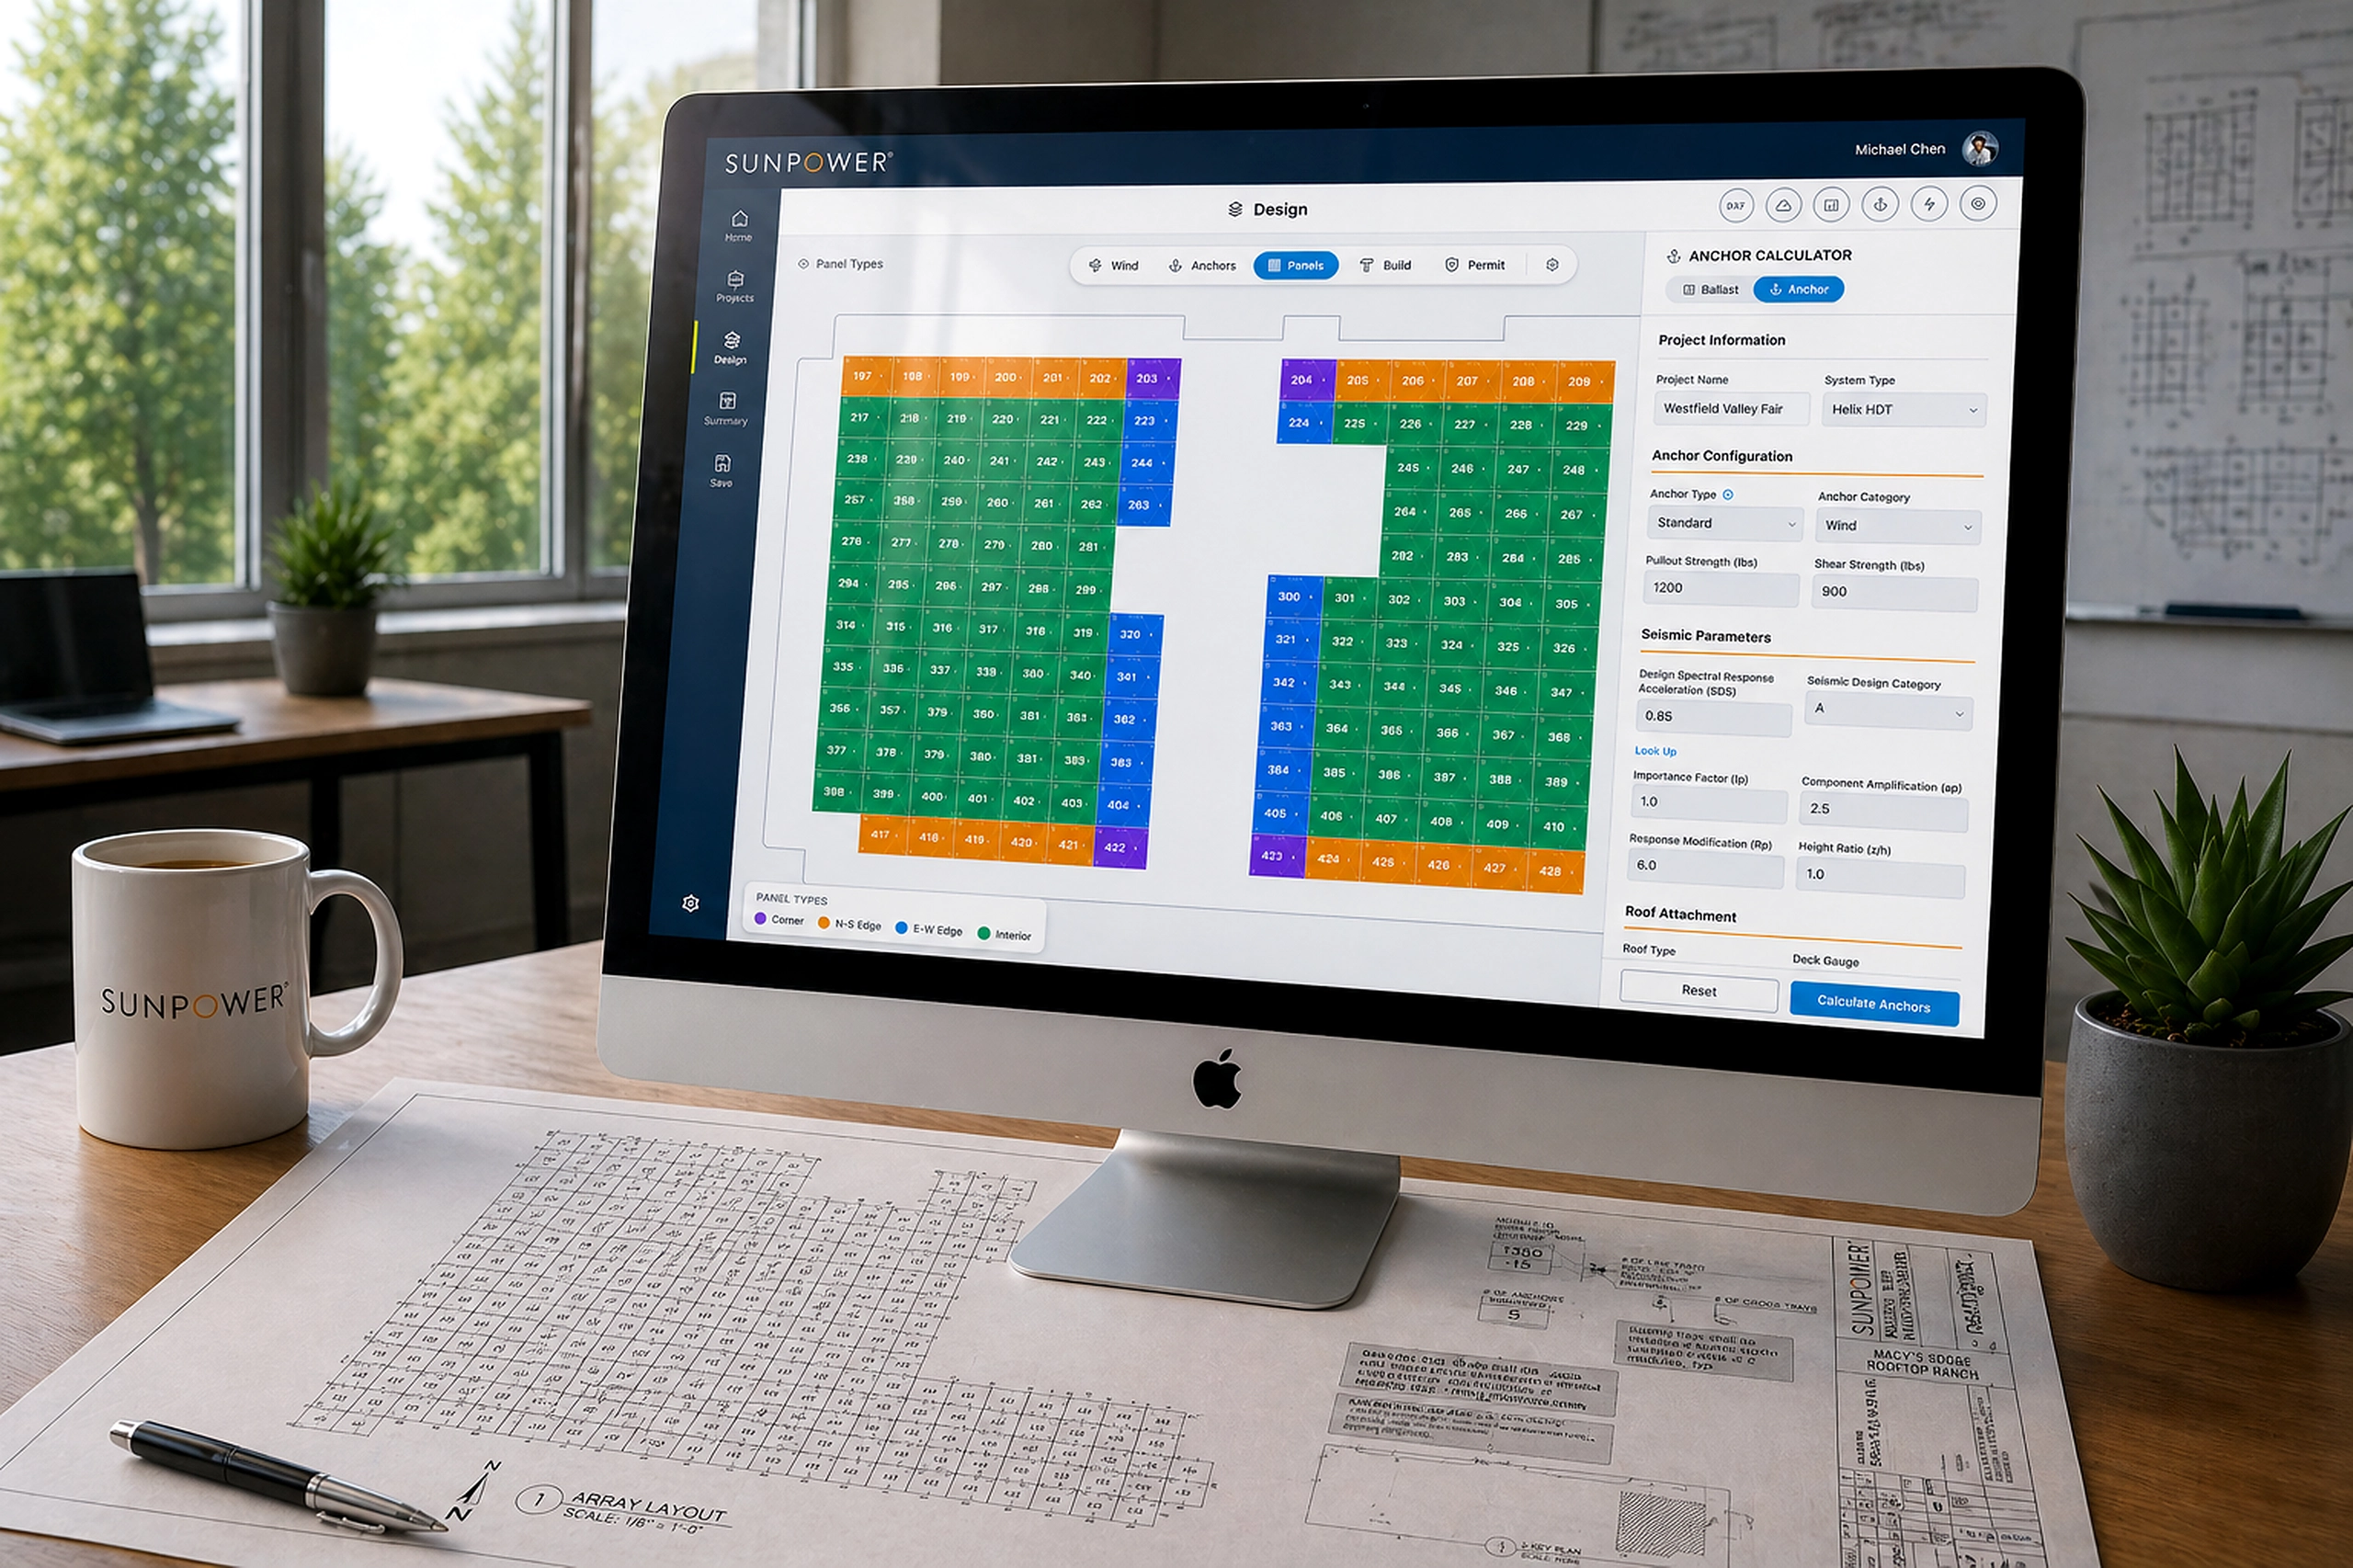
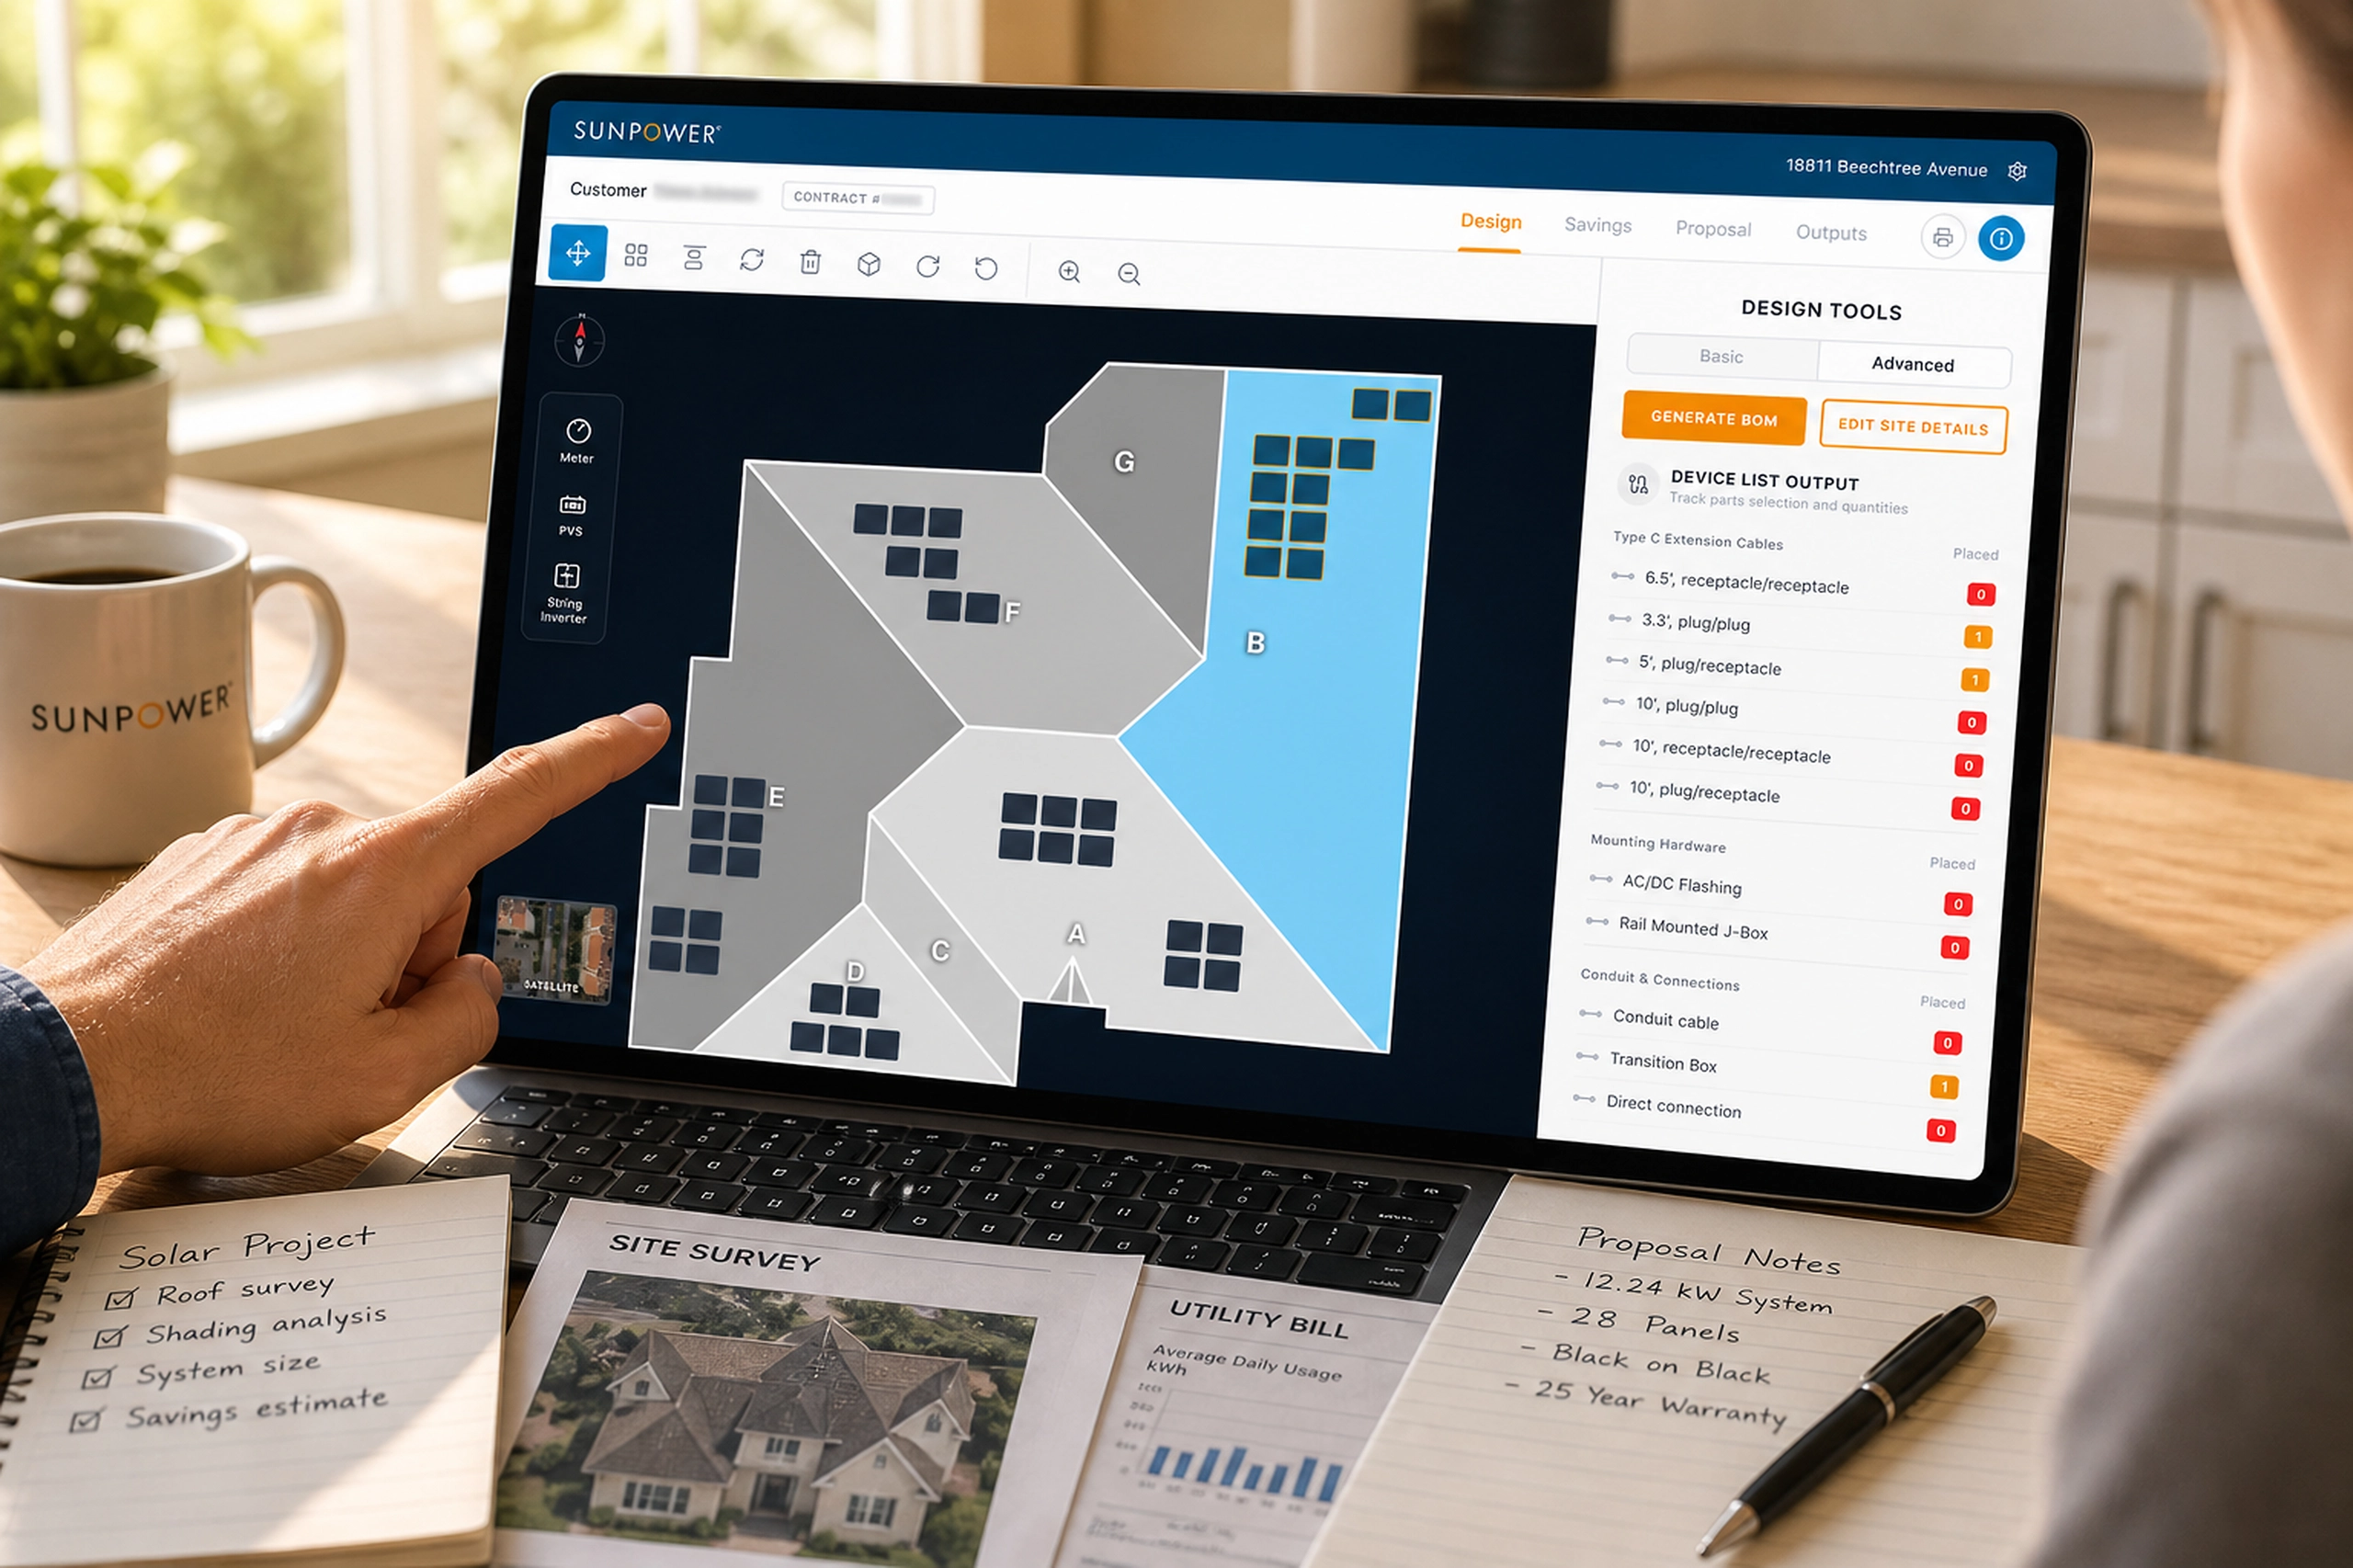
Moving from feasibility into detailed design
After simulation, GEO supported a more detailed design mode. The interface showed estimated modules, GCR, DC/AC ratio, tilt, azimuth, tracker system, module selection, inverter selection, and layout optimization controls.
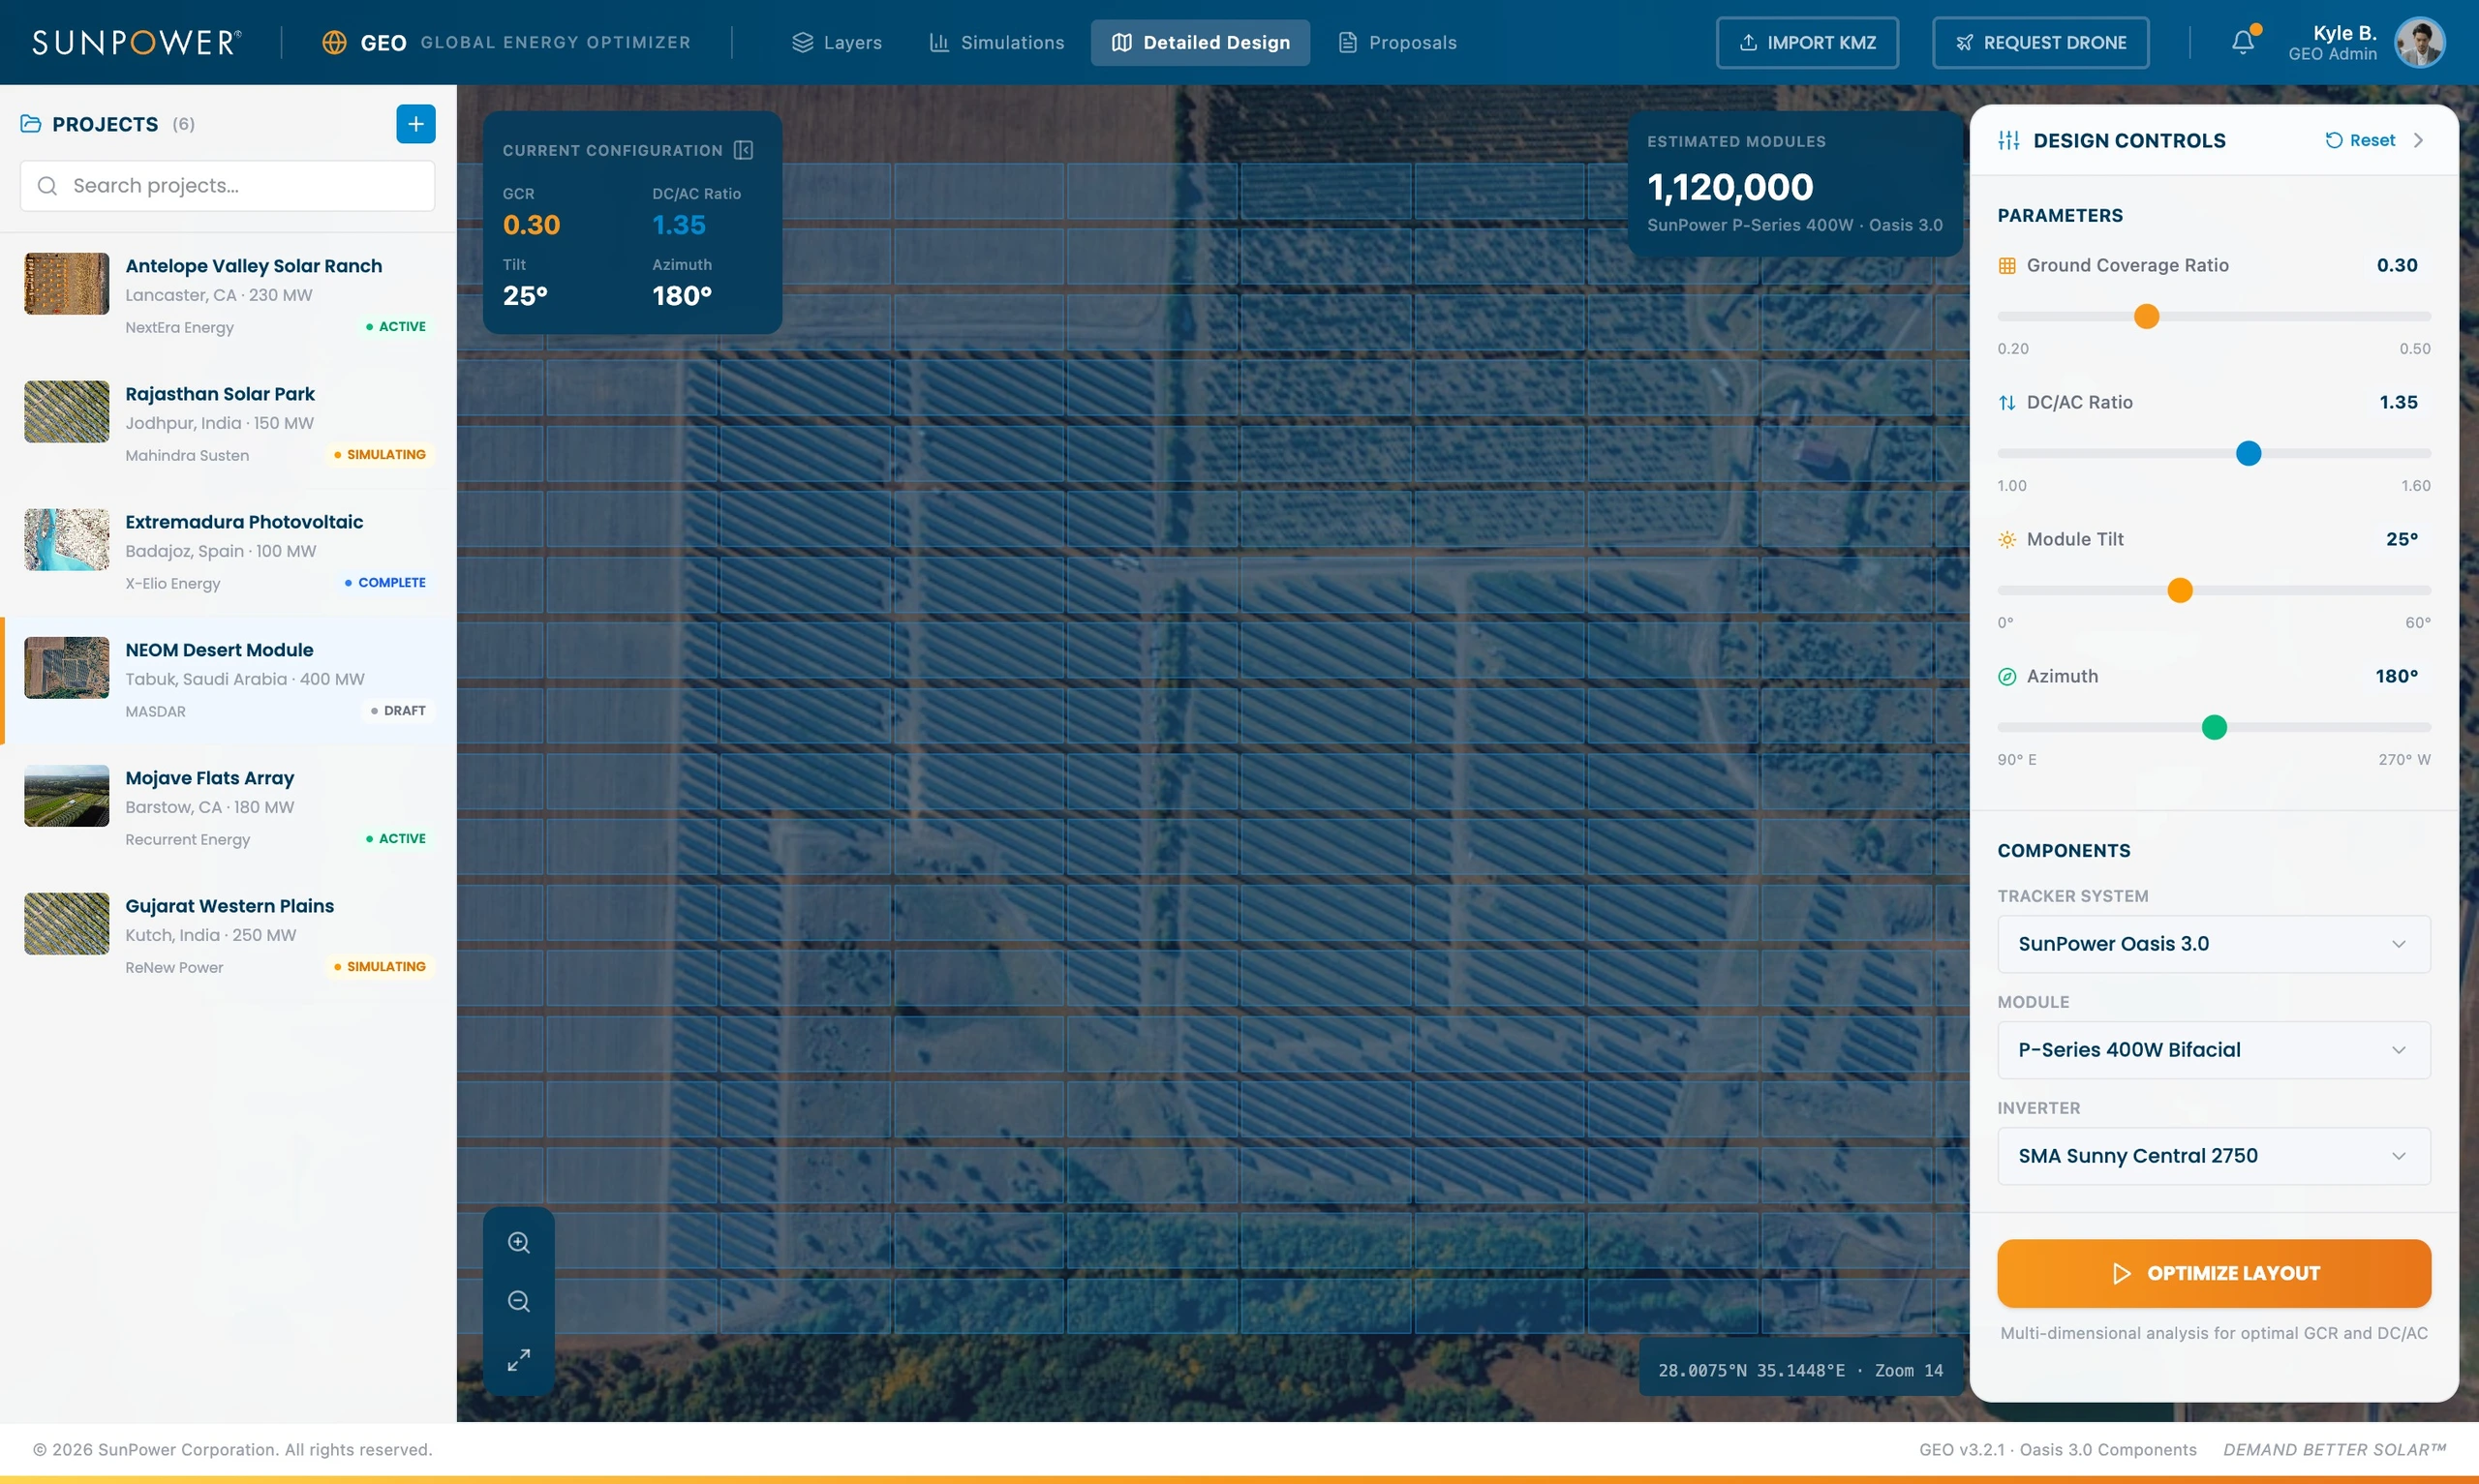
This step connected high-level feasibility to practical system configuration. The design controls made the planning model editable, not just reportable.
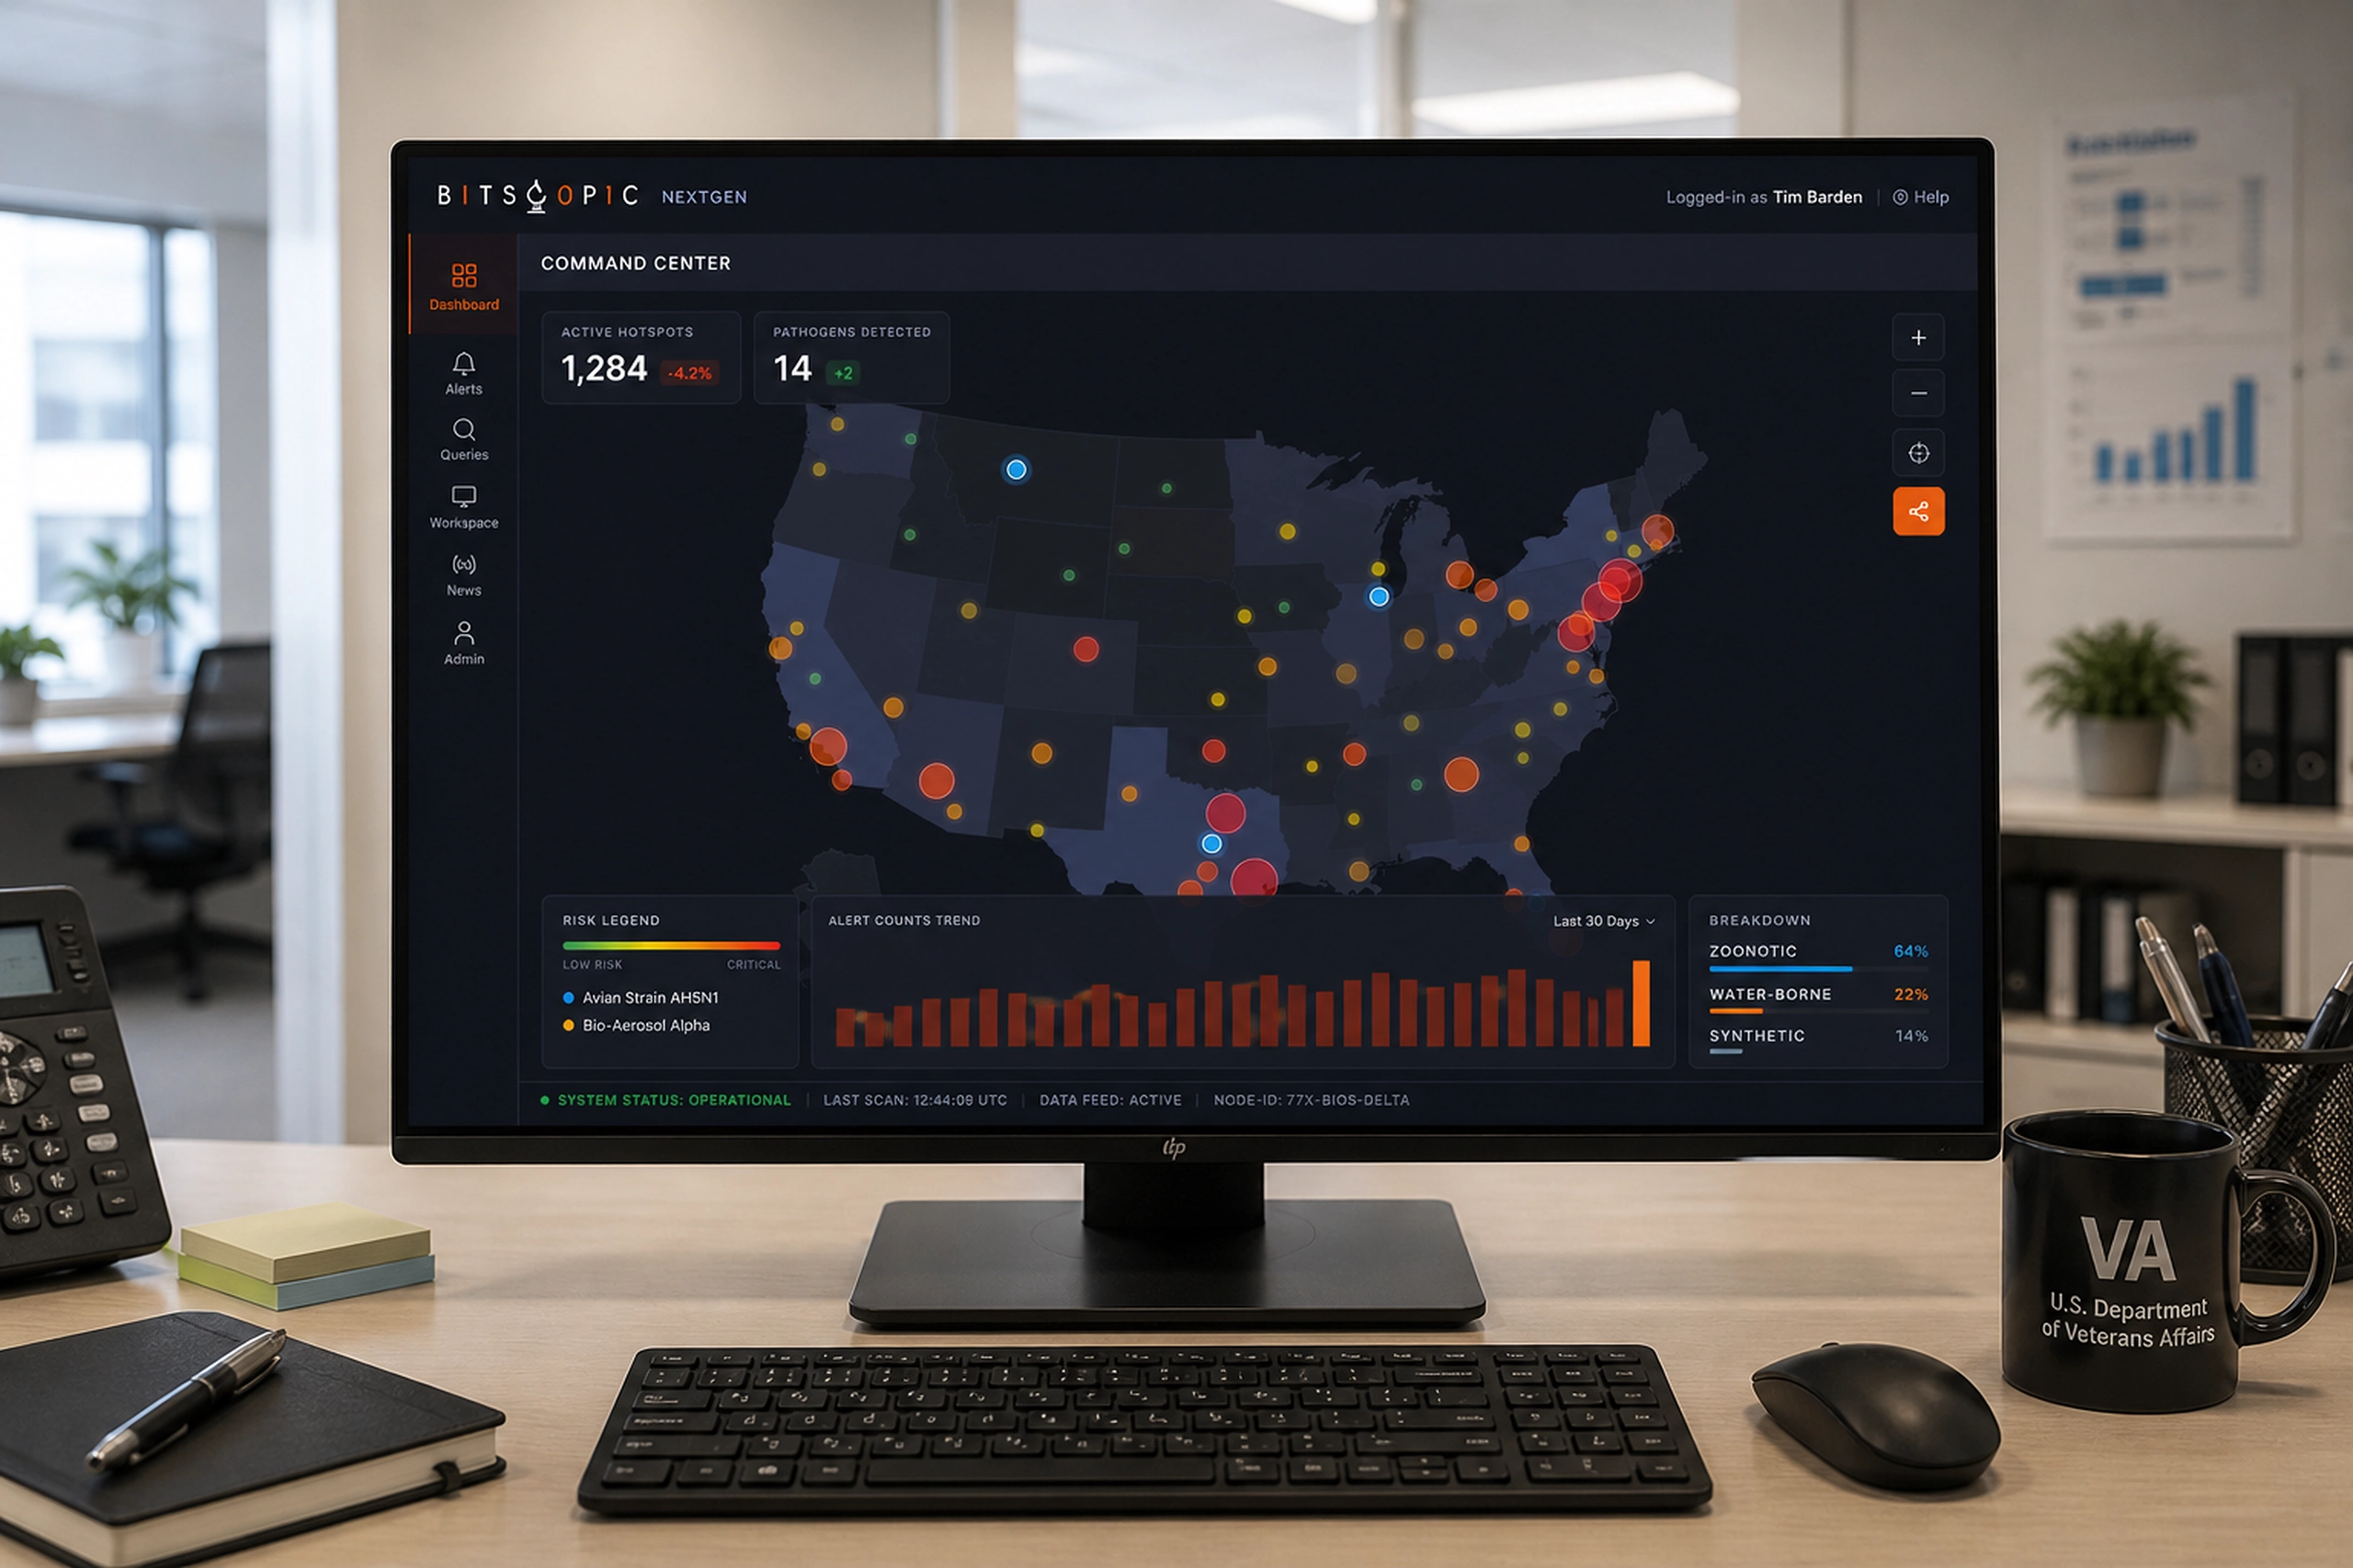
Connecting design work to proposal output
The final step was output. GEO connected project summary data, system details, annual production, bill of materials, component costs, and financial analysis into a proposal-ready view.
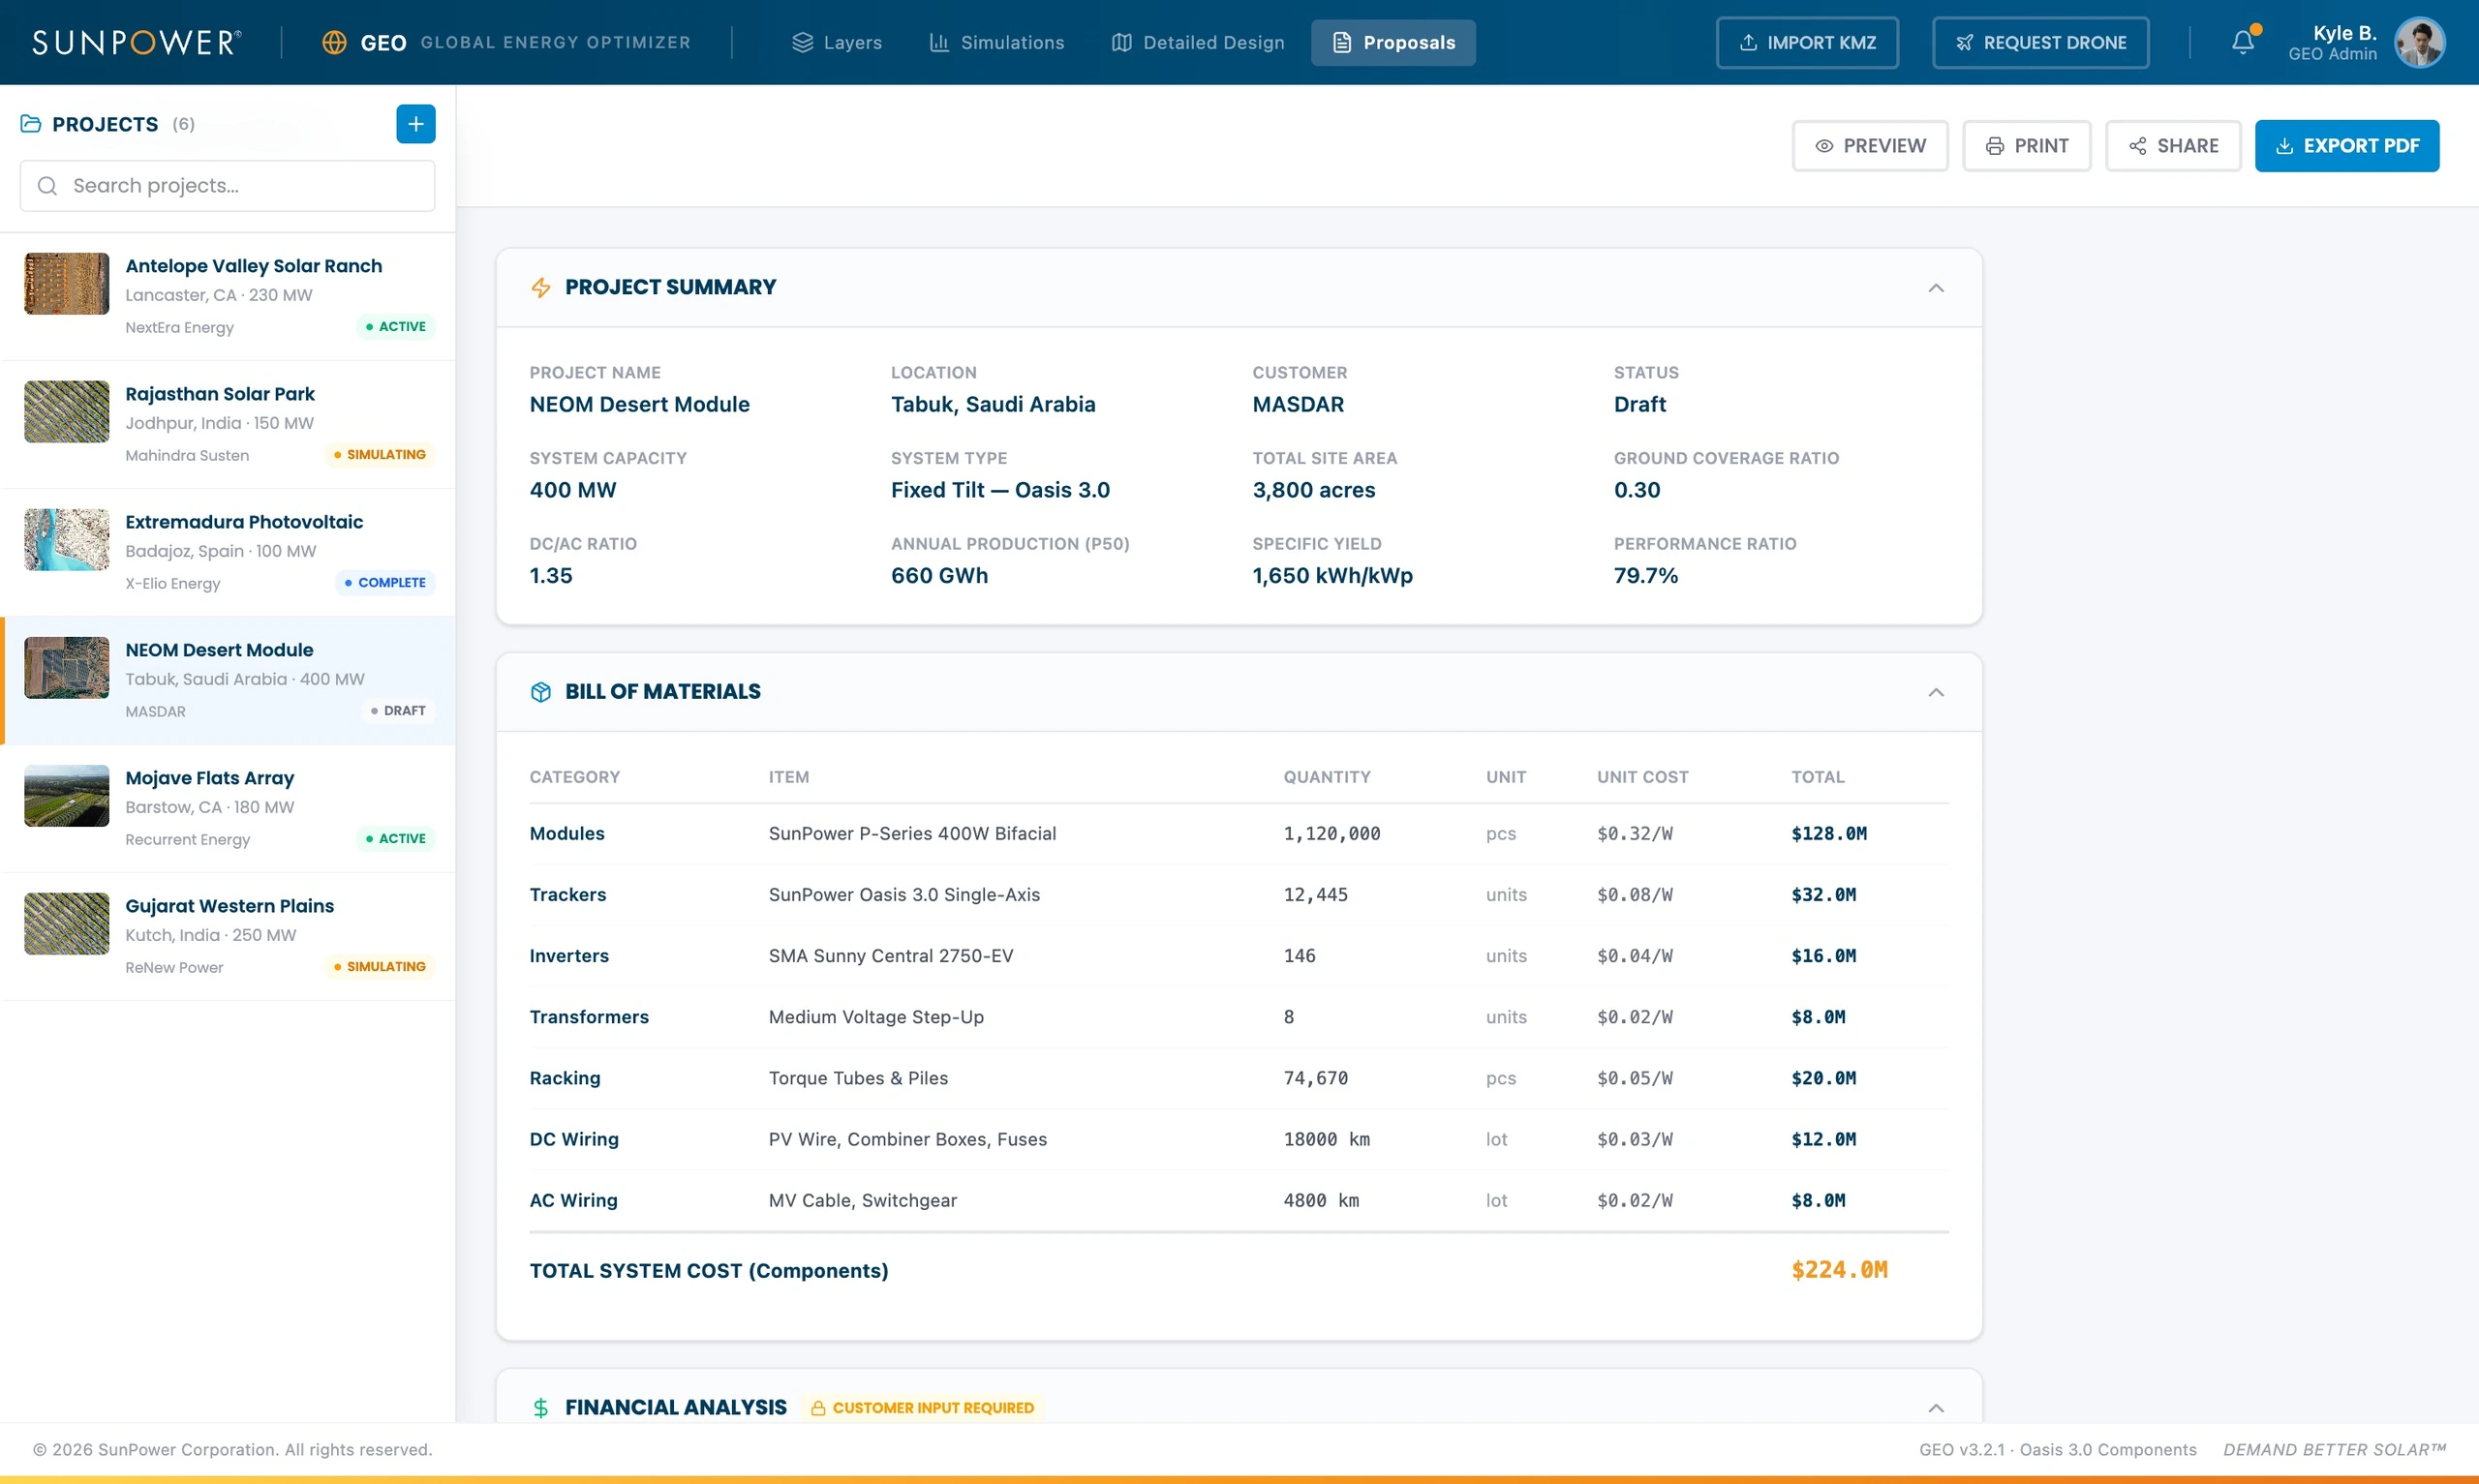
This closed the loop between geospatial analysis and business communication. A site plan was no longer isolated from the commercial conversation. It could feed the proposal, the BOM, and the next decision.
Related Projects
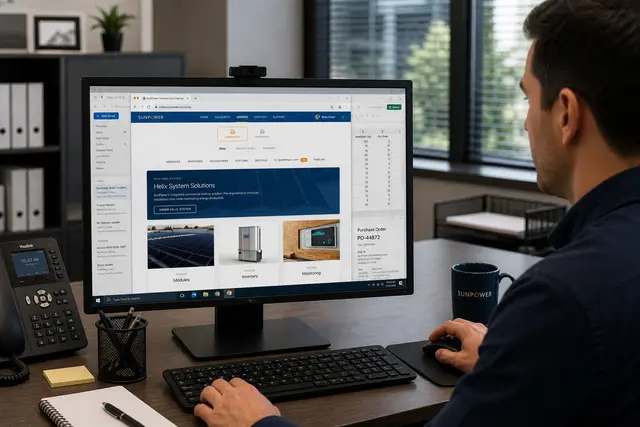
Commercial Ordering System
A redesigned commercial ordering workflow that turned complex solar BOMs into faster, reusable de...
Energy & Climate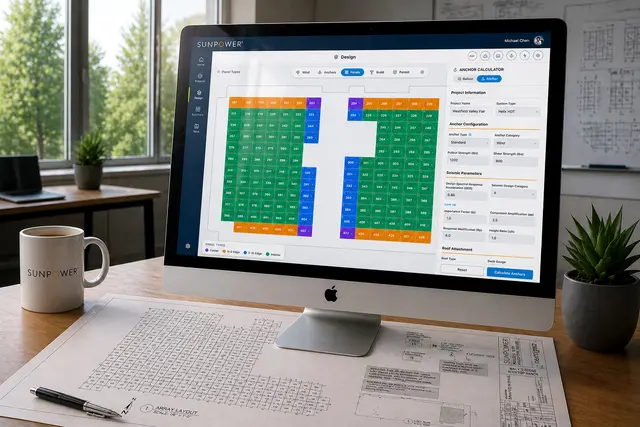
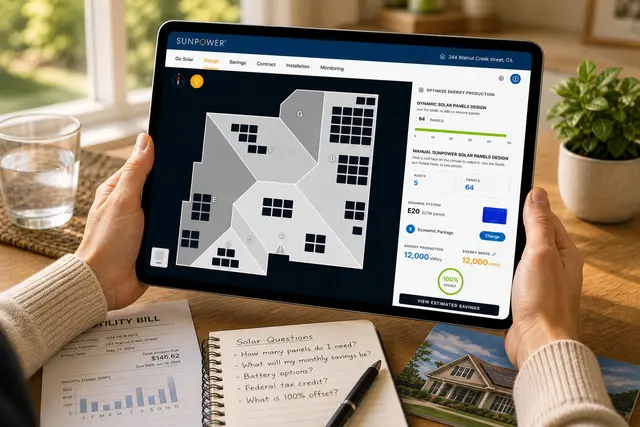
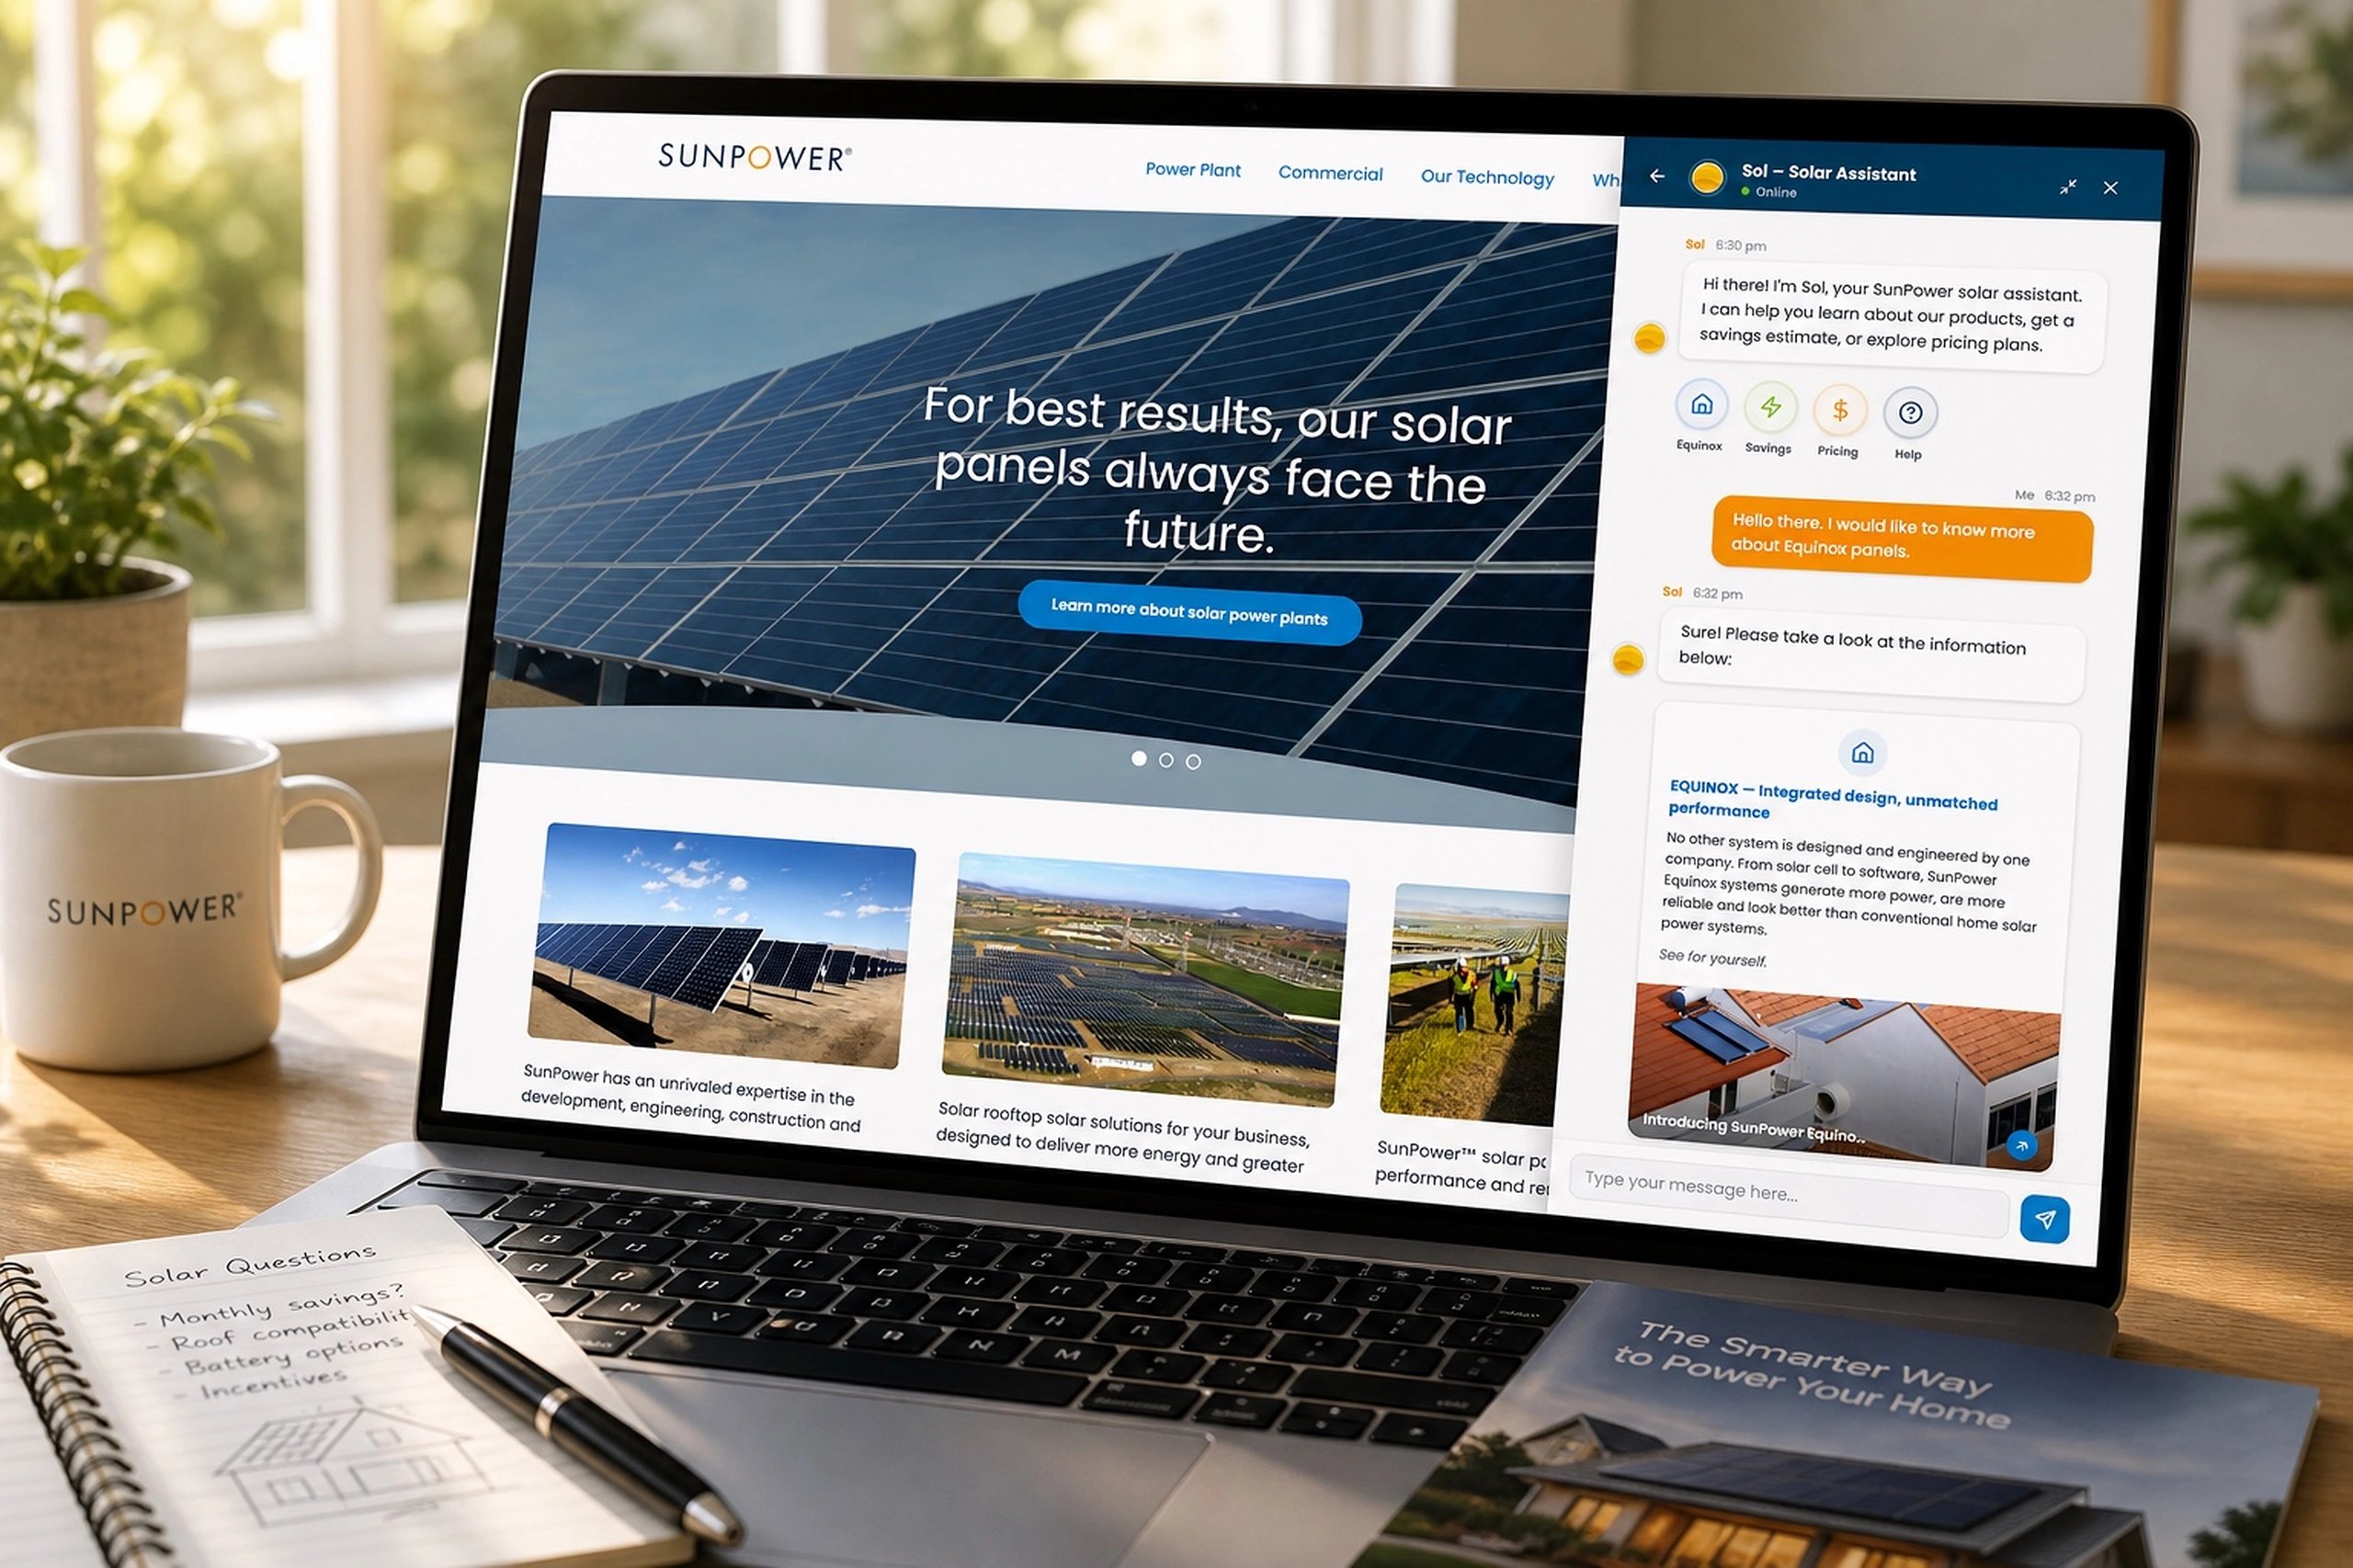
Helix Calculator
A CAD-like commercial solar design tool that helped dealers create accurate rooftop layouts in mi...
Energy & Climate
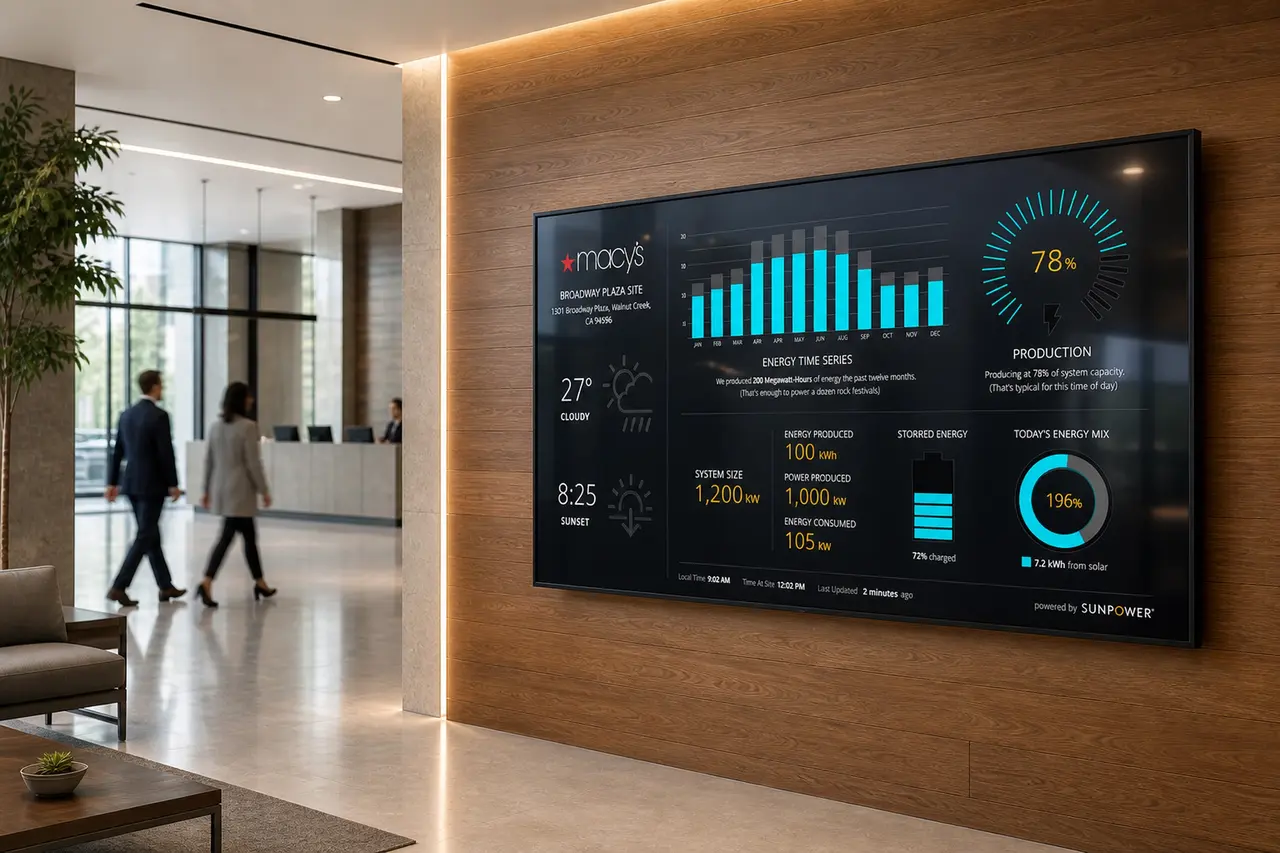
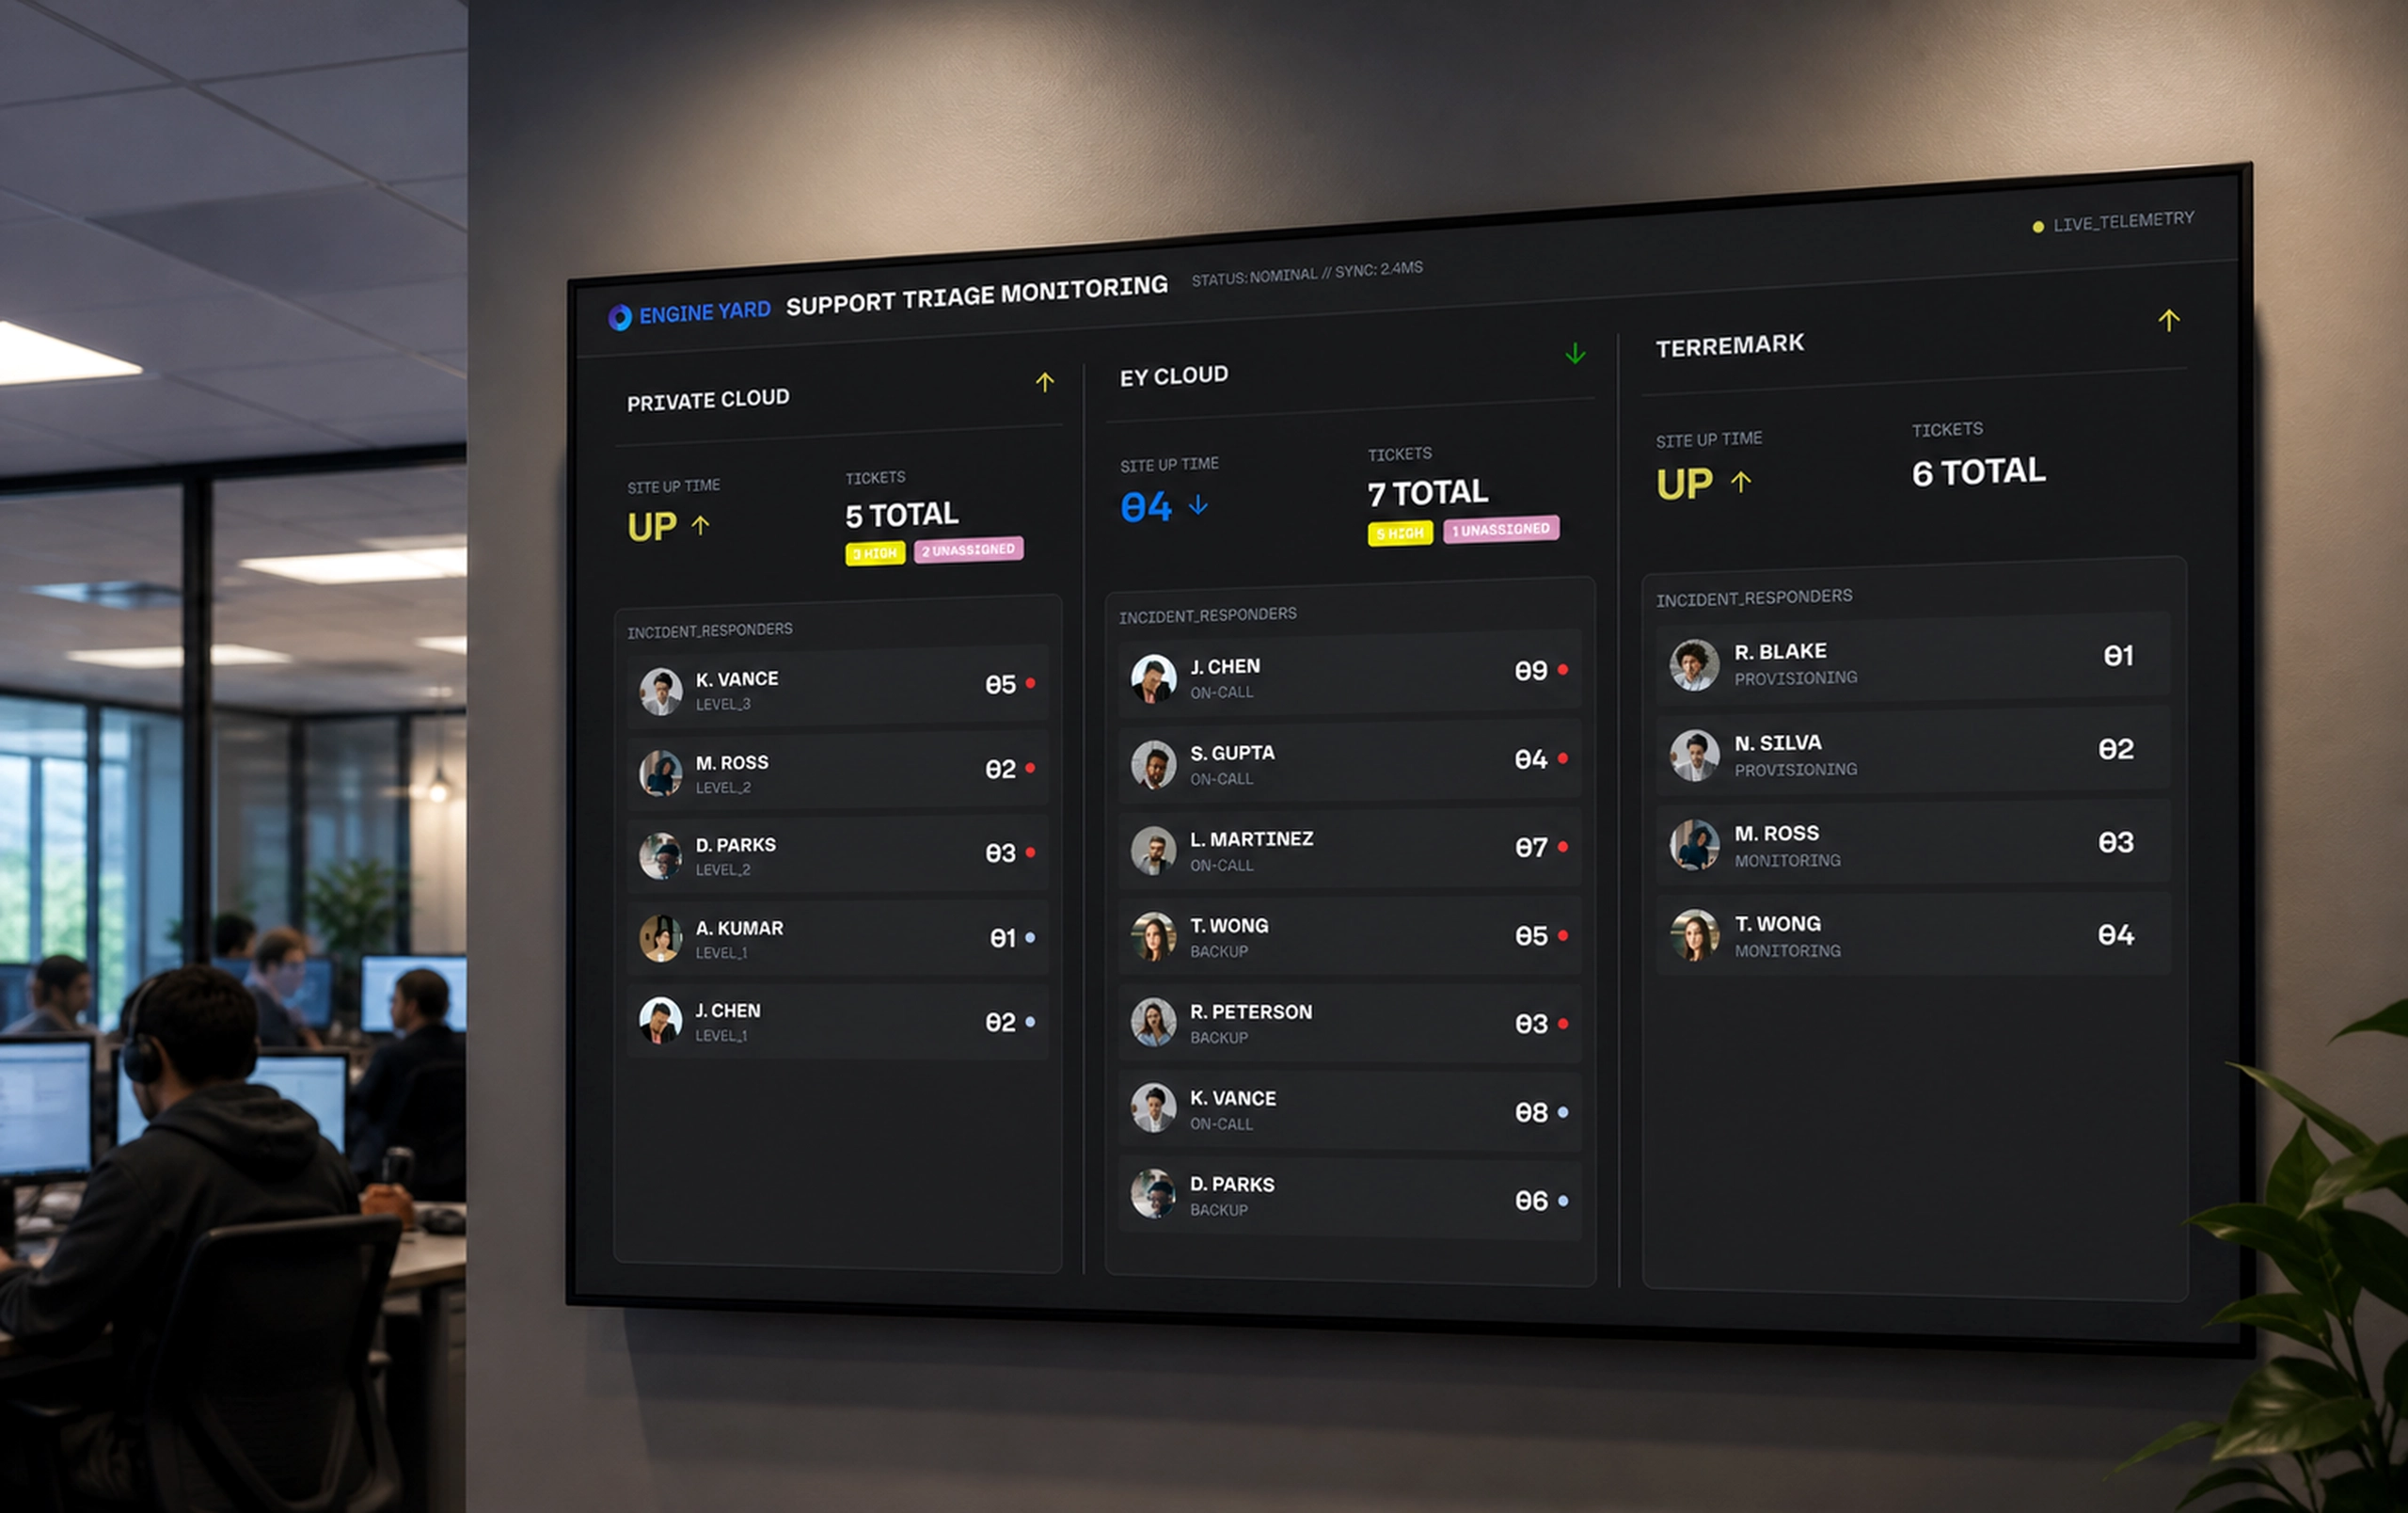
Energy Monitoring Kiosk
A lobby-scale energy dashboard that helped commercial clients visualize solar production, system ...
Energy & Climate